Designing role-based dashboards by harnessing AI/ML
Turvo Inc.
Supply chain and logistics
Sr. Director of User Experience
2.3 years (2021 - 2023)
Context
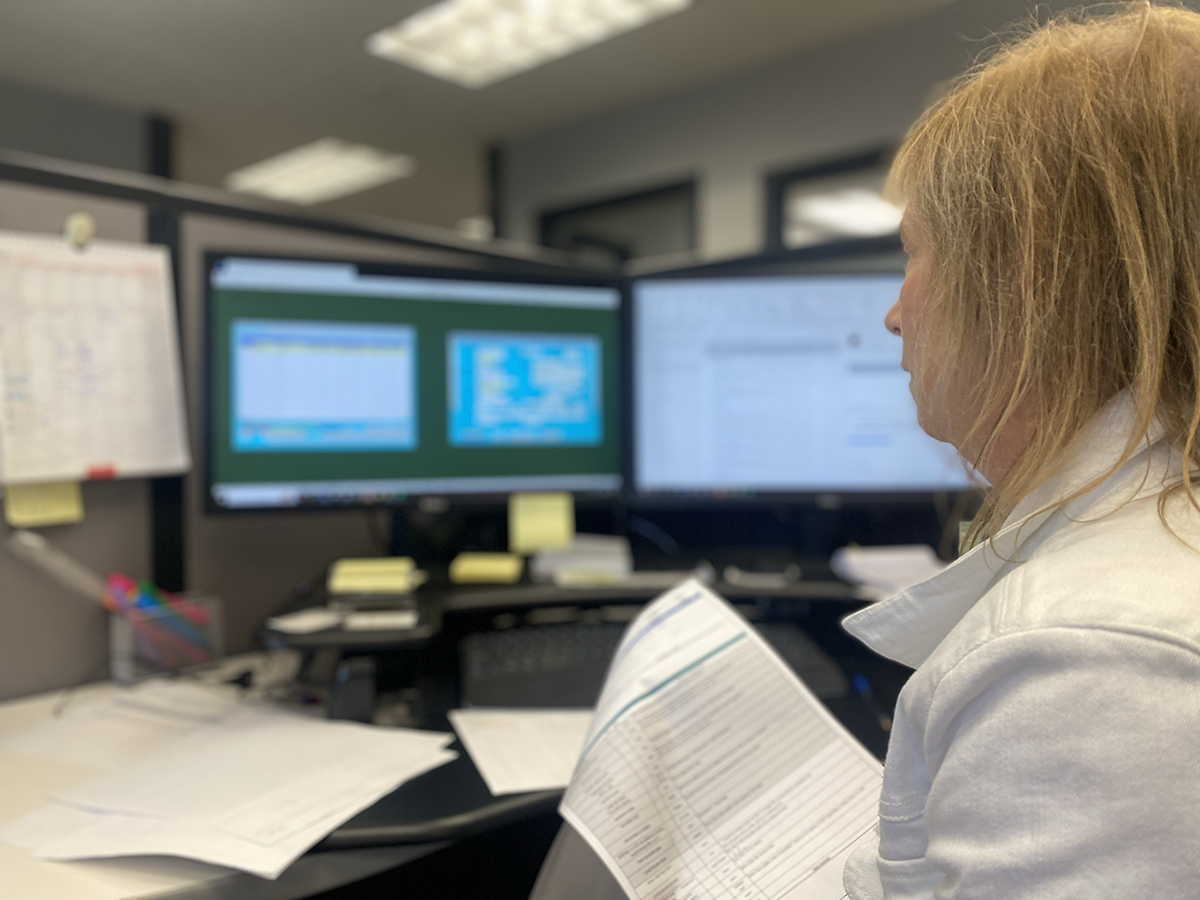
The end users
Transportation planners, Logistics, and Inventory managers.
The business problem:
The lack of real-time and tailored data hindered the ability to optimize transportation processes and inventory problems, resulting in revenue loss in the millions.
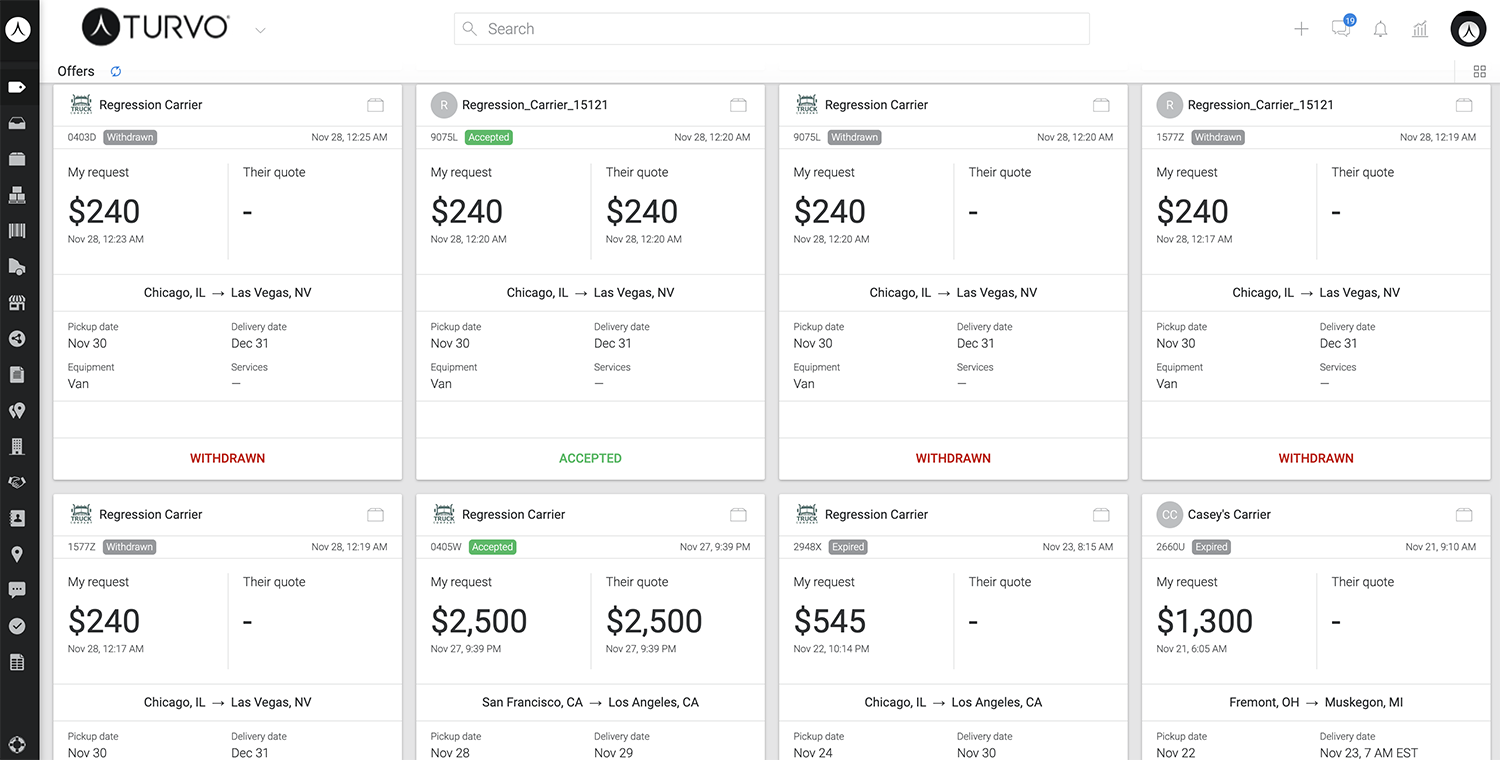
The product problem:
Turvo's platform did not offer role-based dashboards for operational groups specific to roles within the warehouse causing delays.
The UX problem:
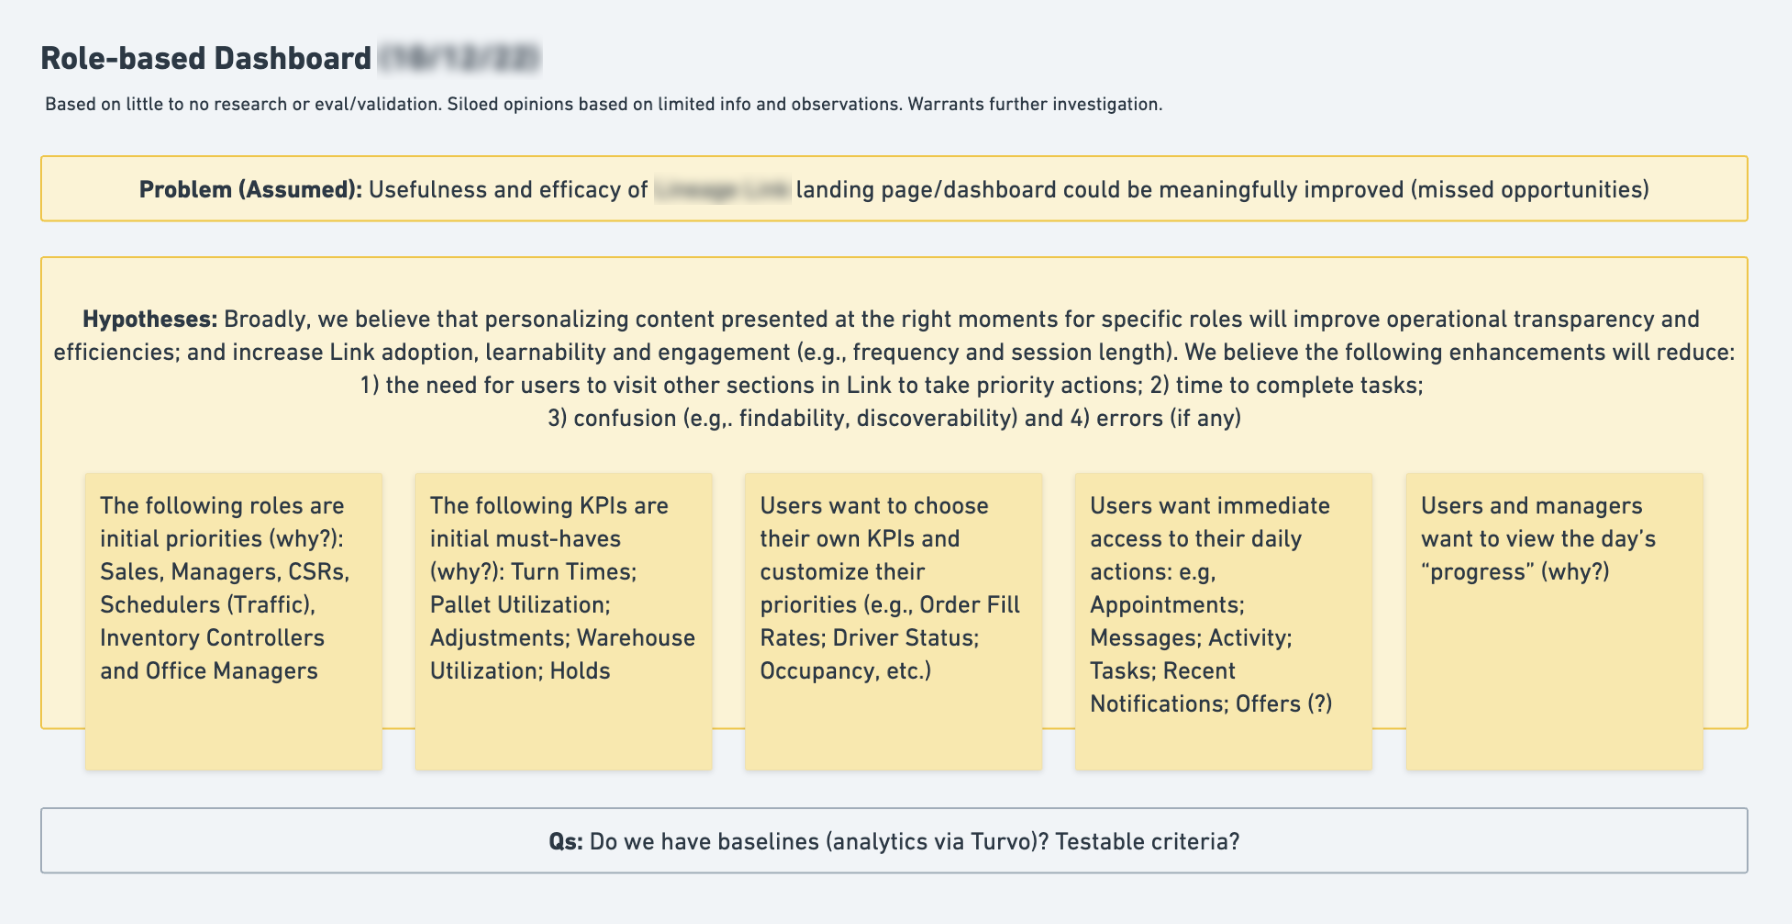
There was anecdotal data that needed to be validated through rapid user research.

The opportunity and outcome
Overcome challenges of delayed data availability, inefficient decision-making, and reactive issue management. We also utilized user research to group use cases by roles and outcomes.
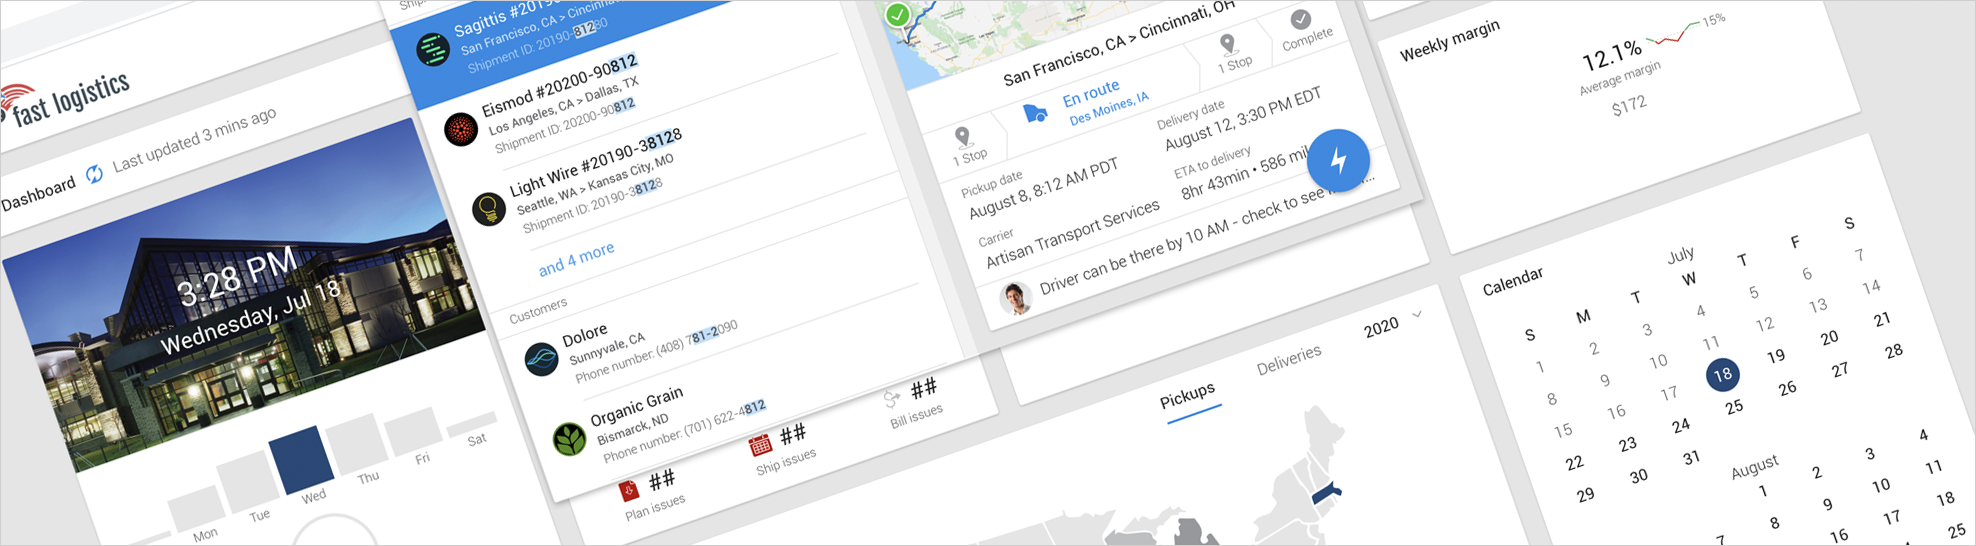
Results:
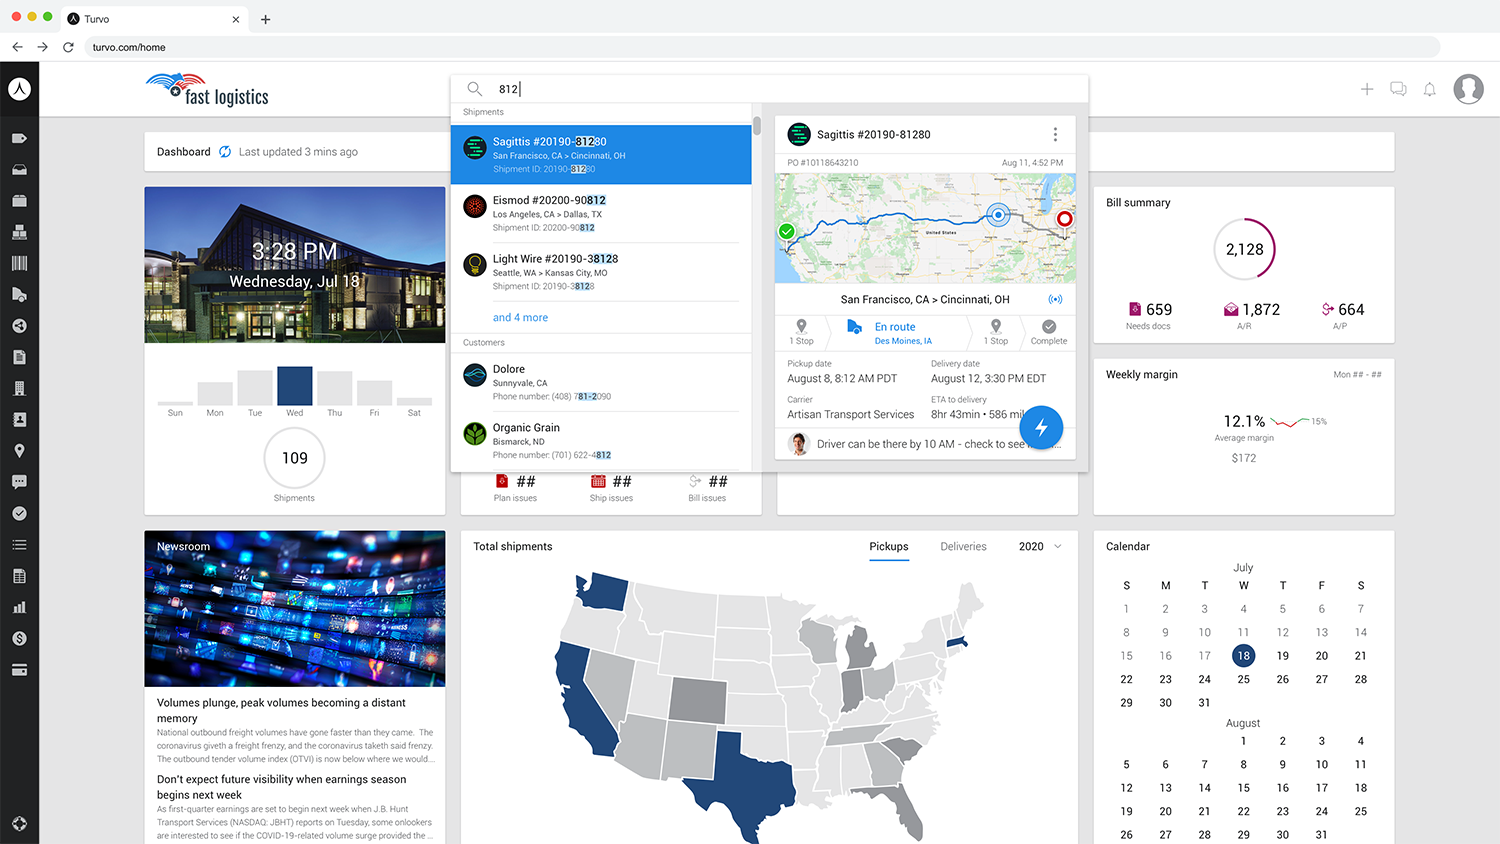
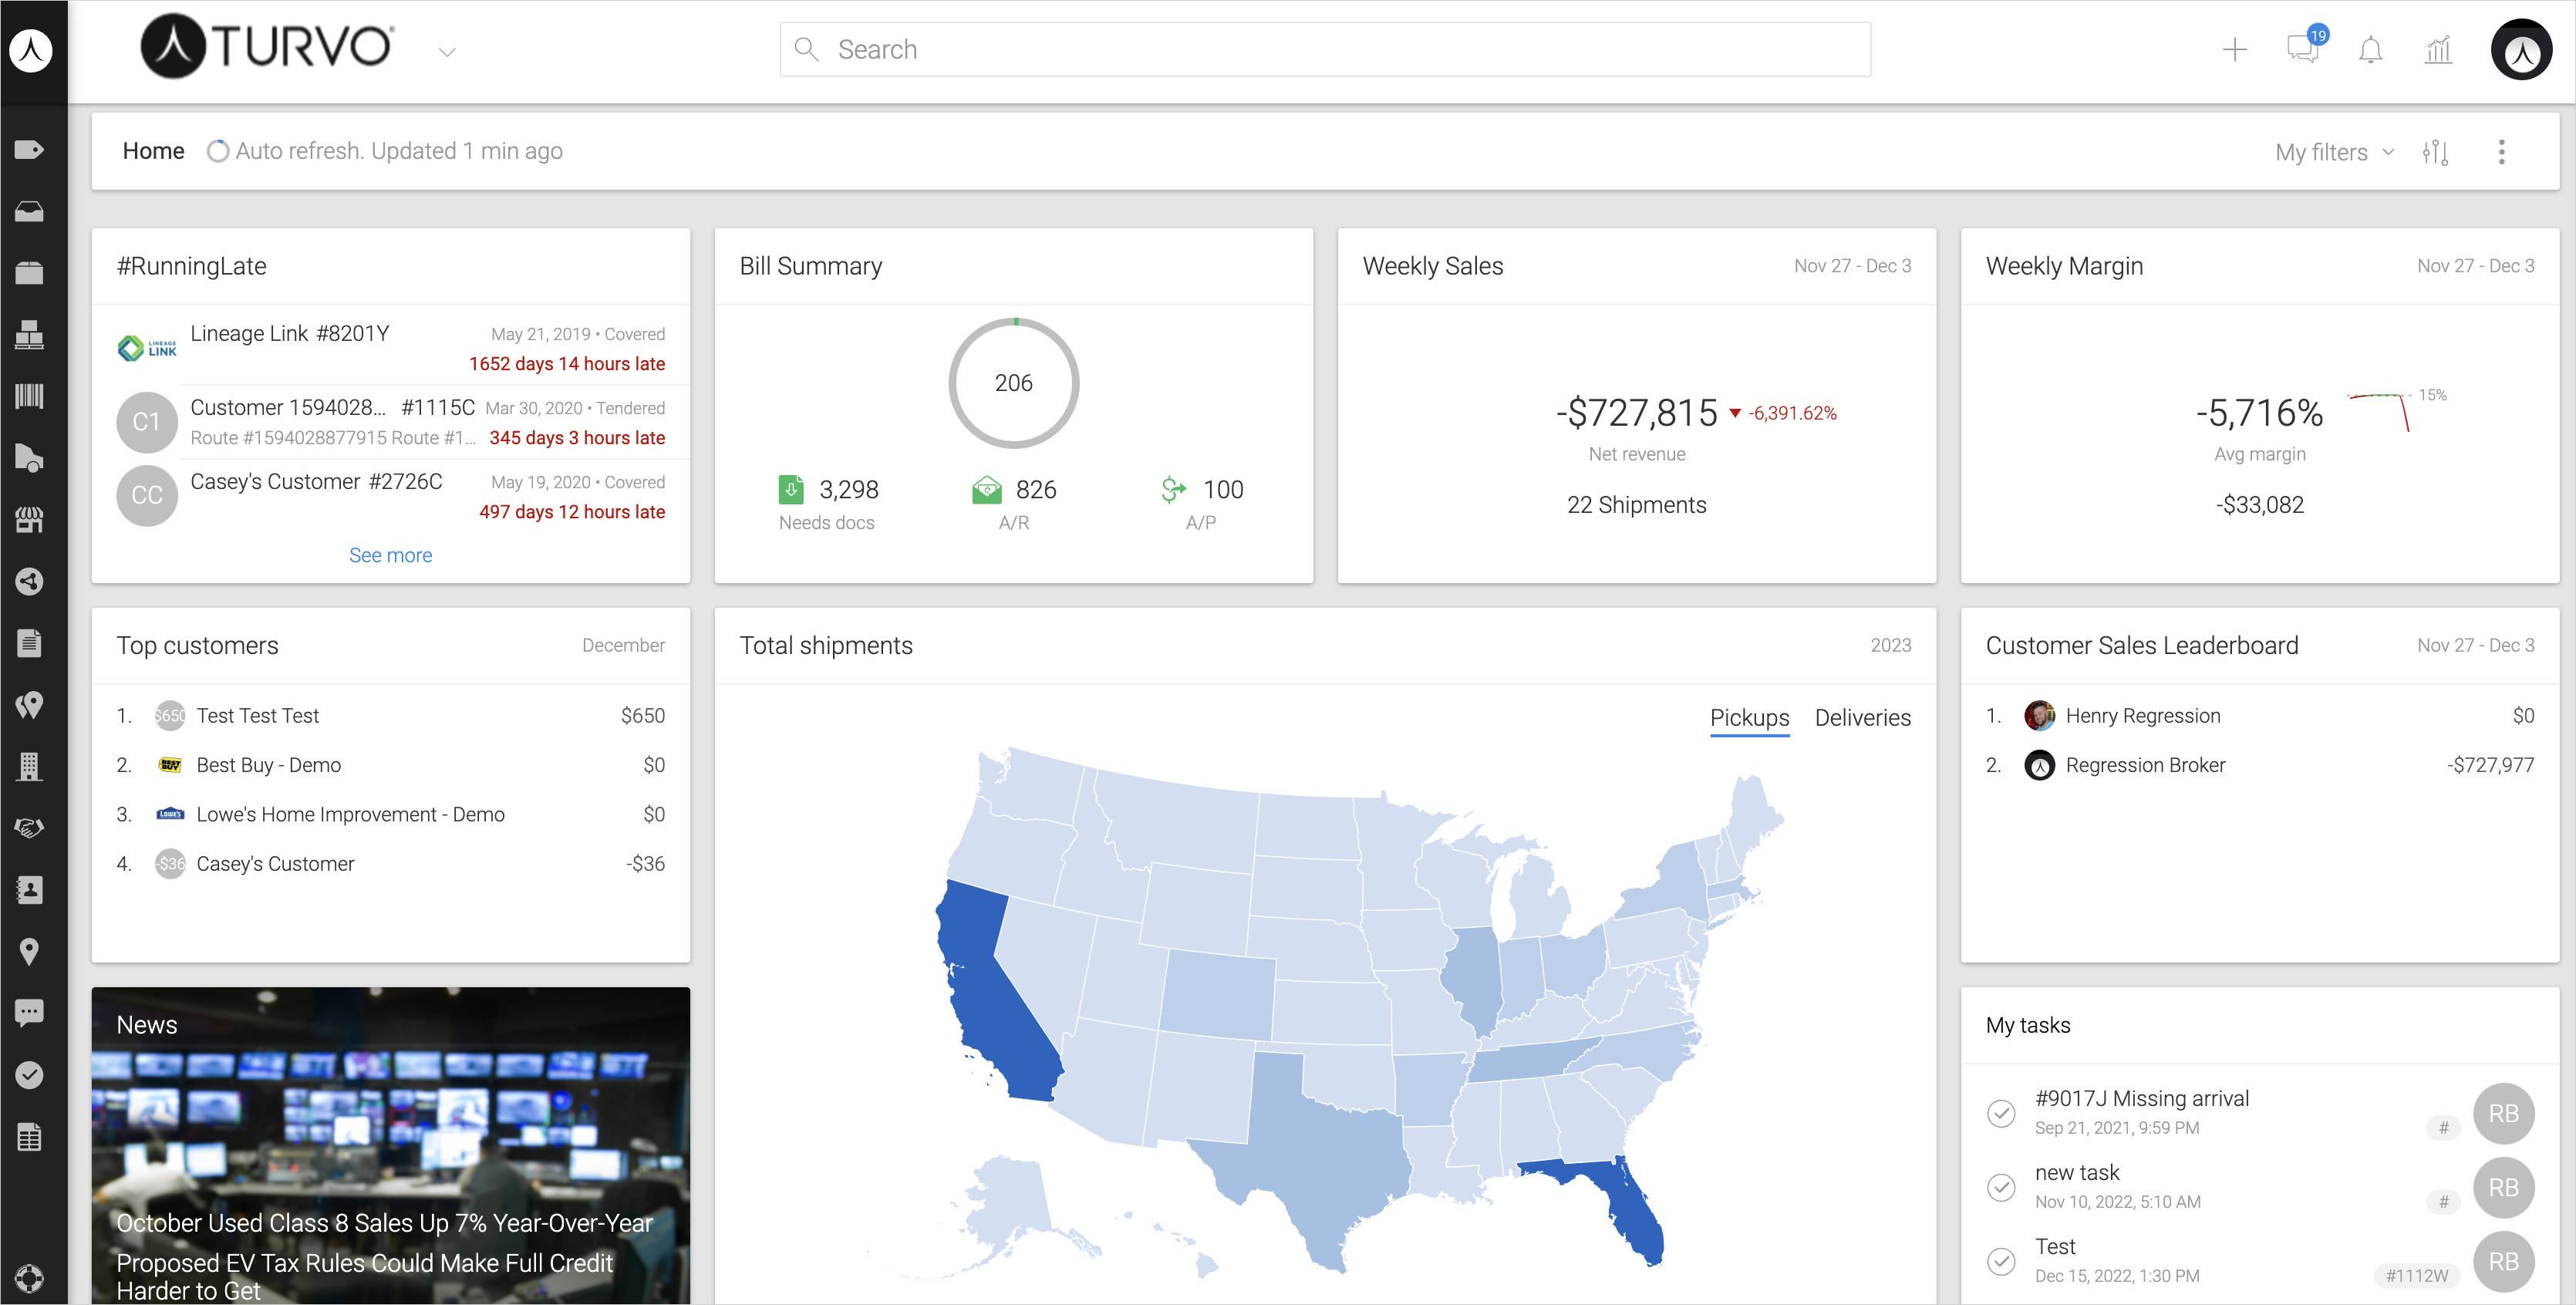
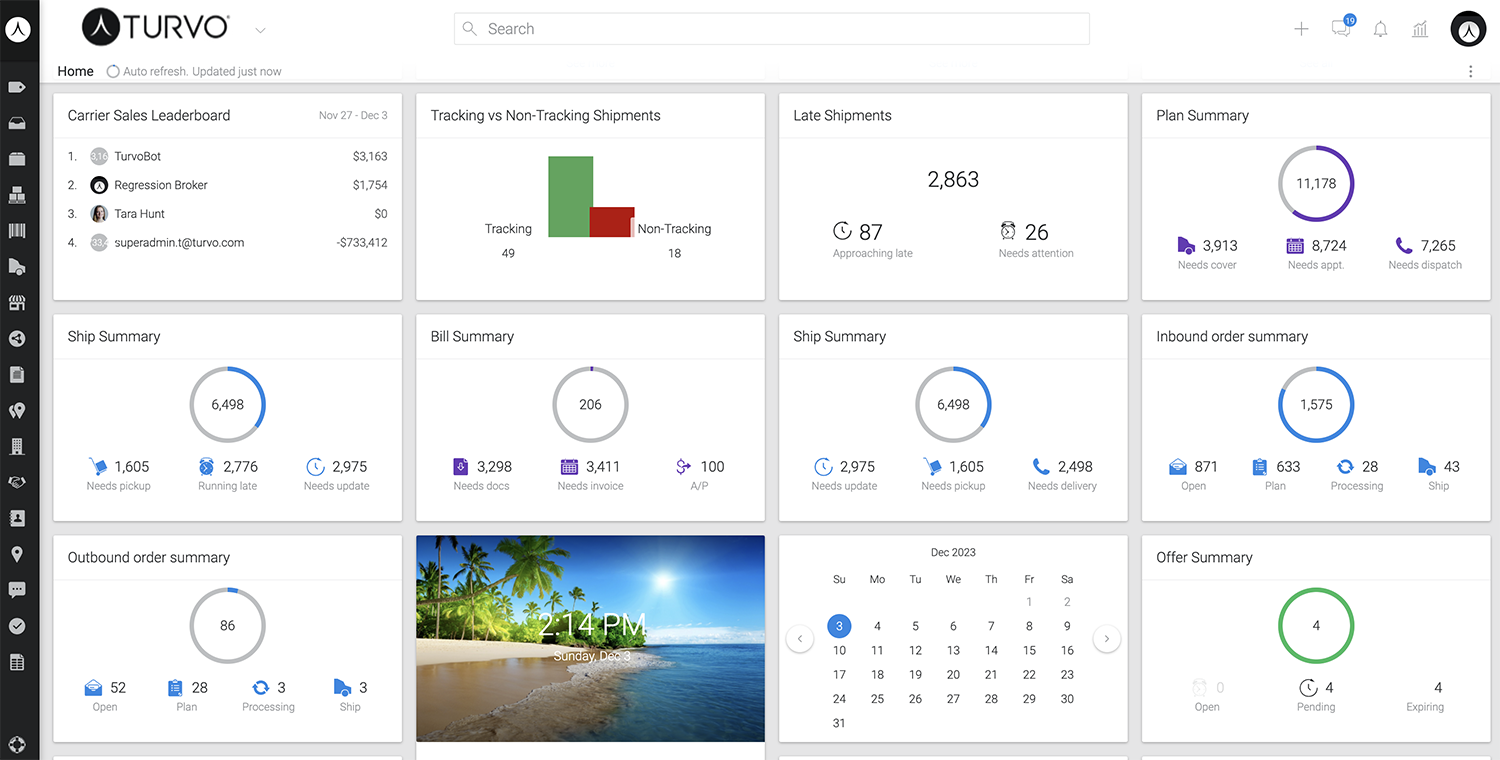
End-user utilization and configured dashboards went up by 75% after successful real-time data integration through multiple data sources, such as transportation management systems, telematics devices, and GPS trackers.
User research and design process
I drafted a research document highlighting the business, product, and user experience goals.
1. Write a clear hypothesis
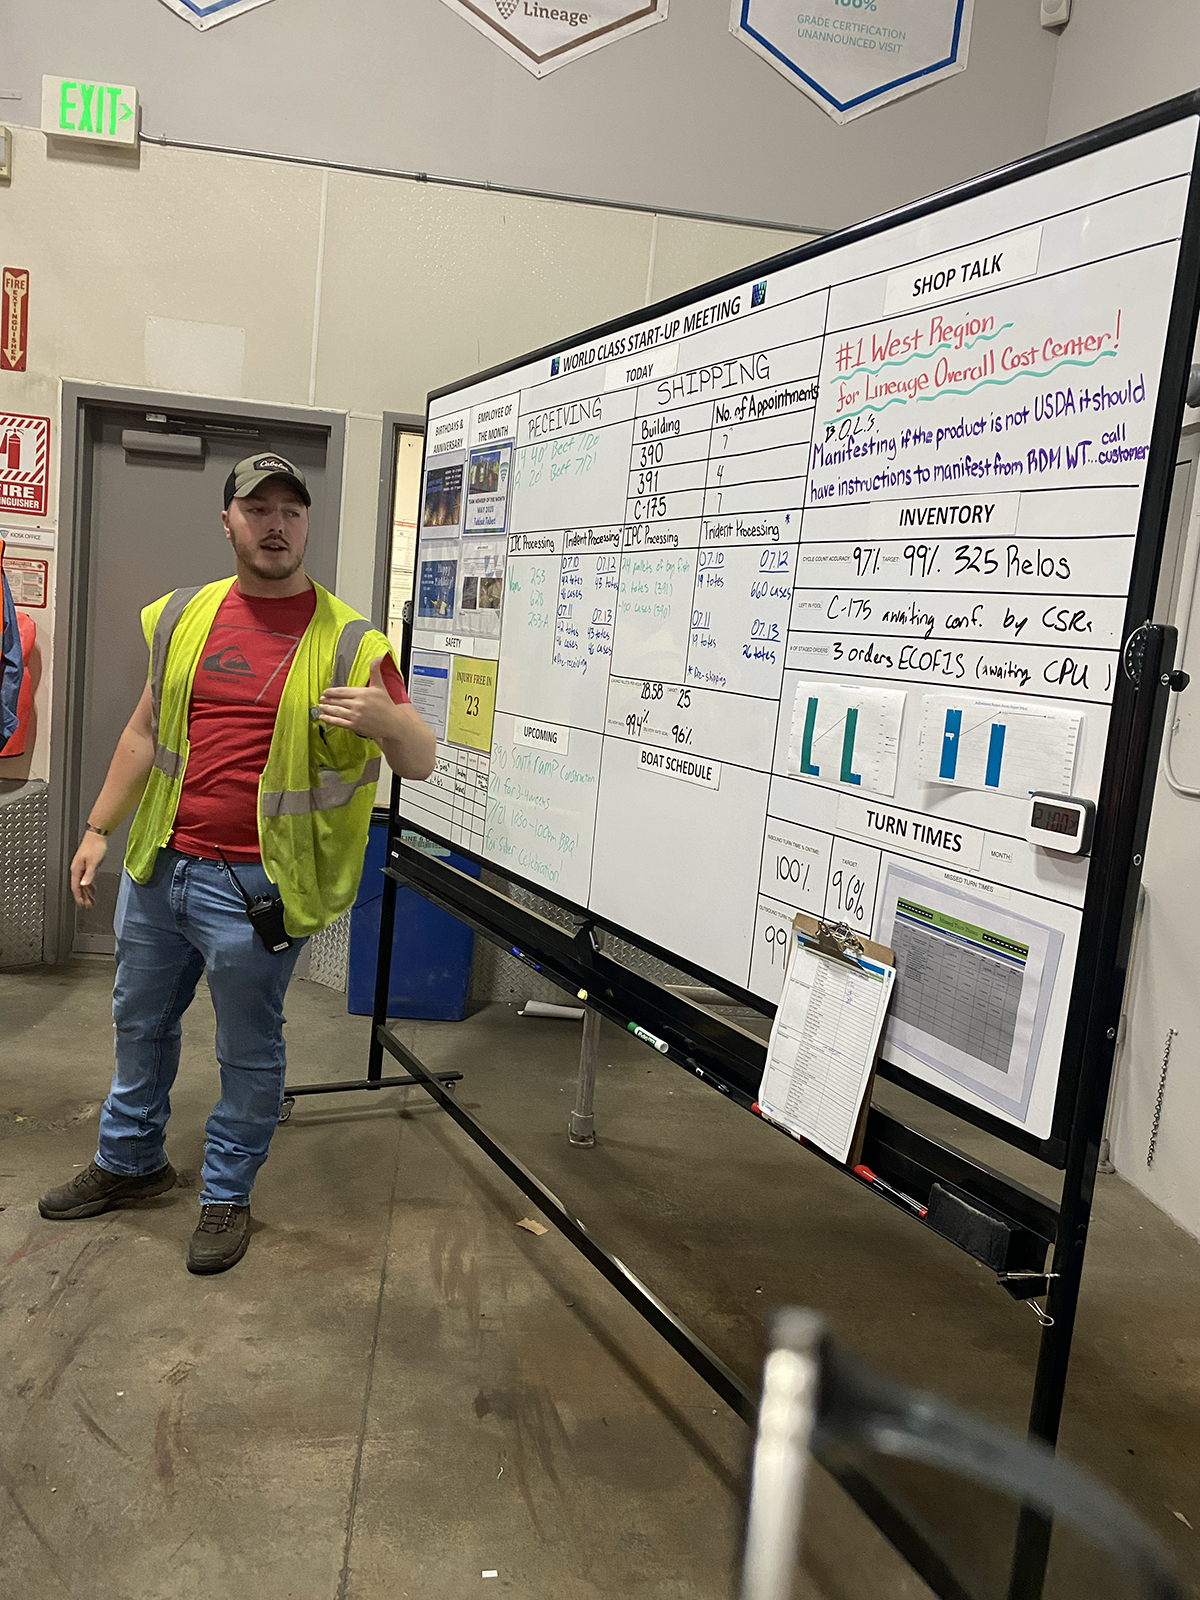
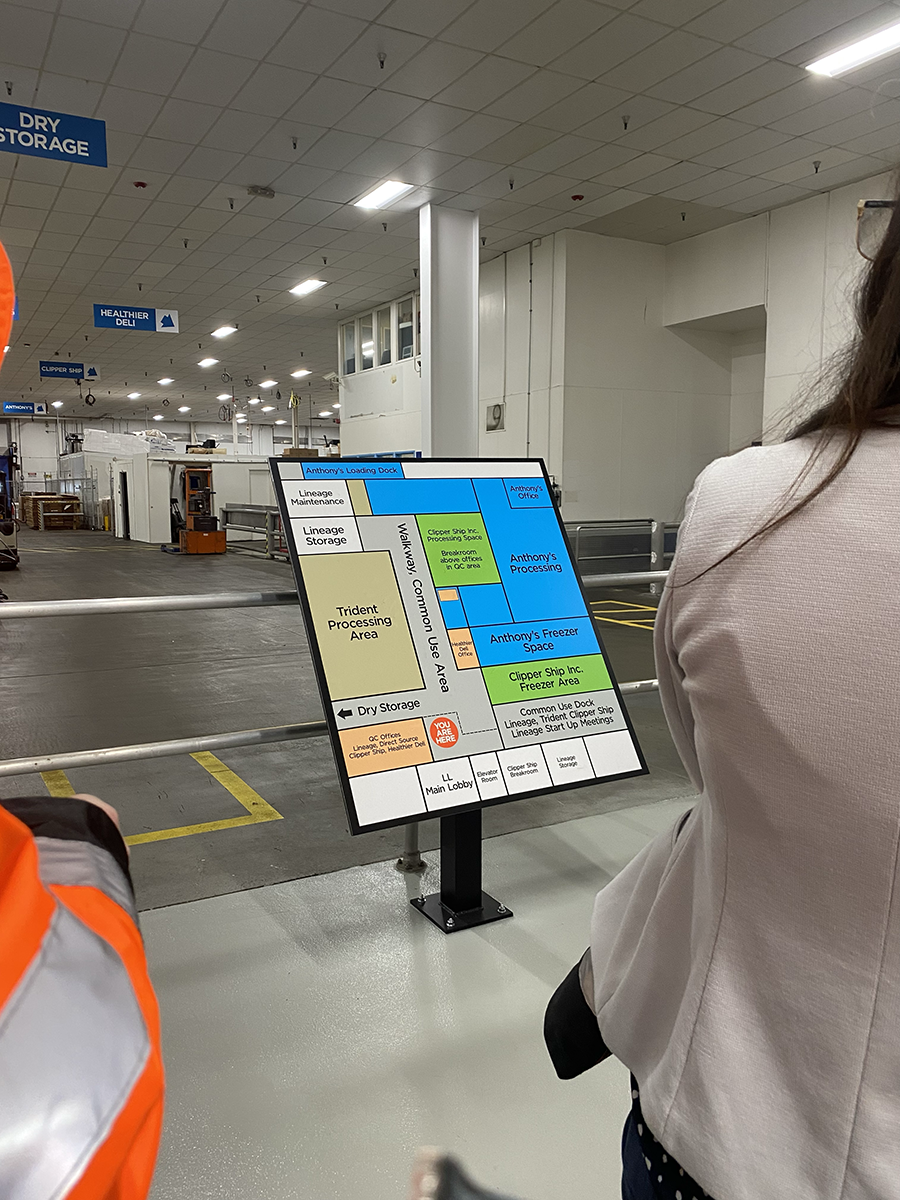
2. Facilitate research interviews with end users -- warehouse, inventory, and transportation managers at seven facilities. 1:1 interviews with both end users and internal team members, a total of 35 interviews.
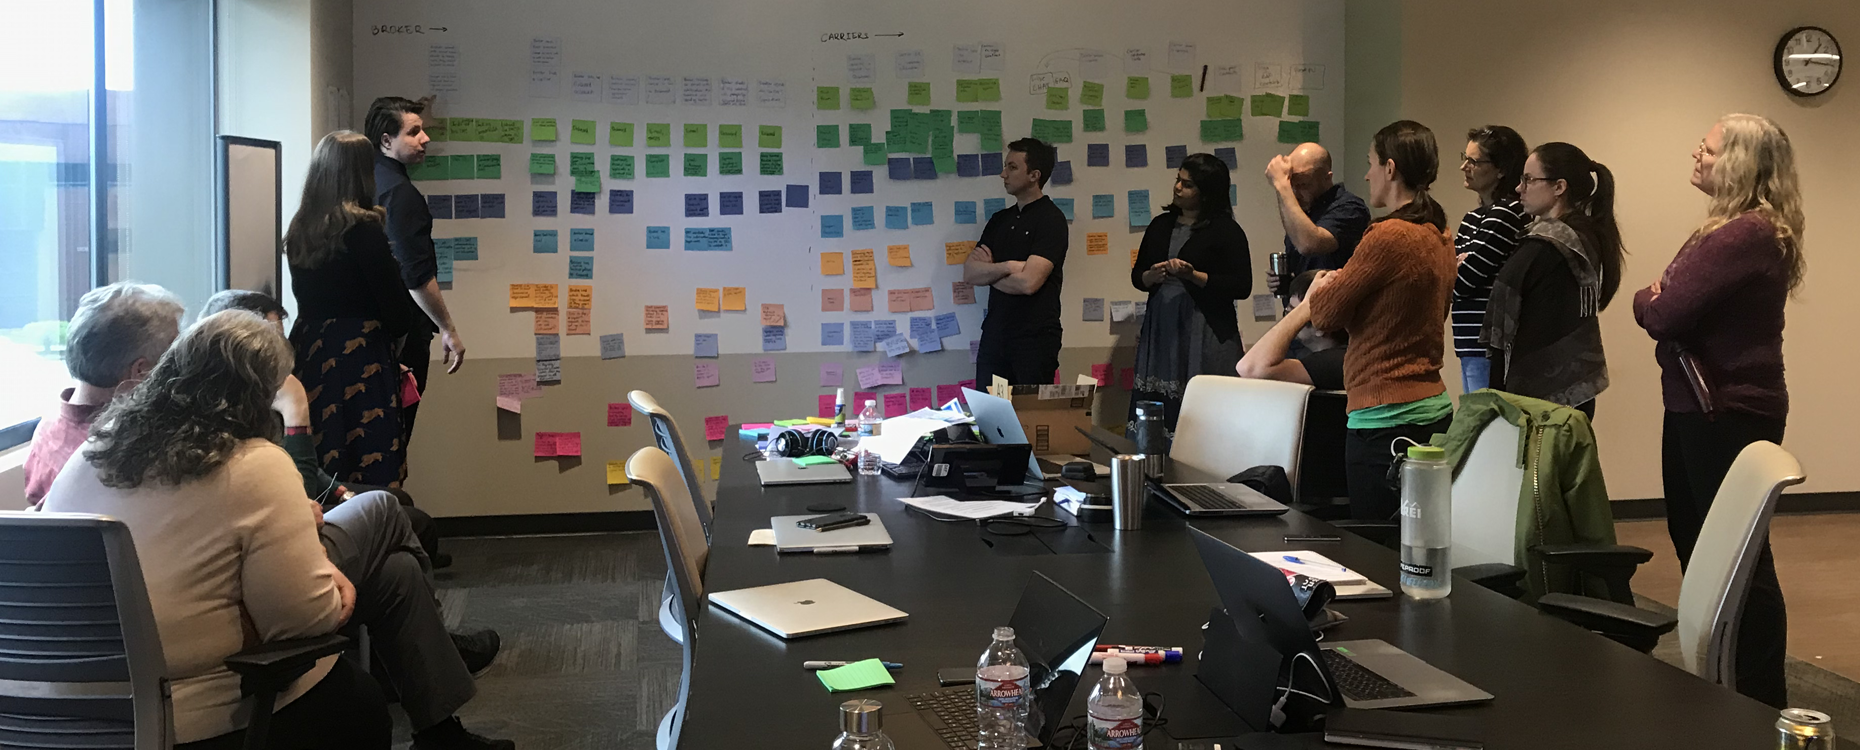
3. Cross-functional design workshop to prioritize and group use cases
4. Presenting research findings of use cases that were validated and prioritized.
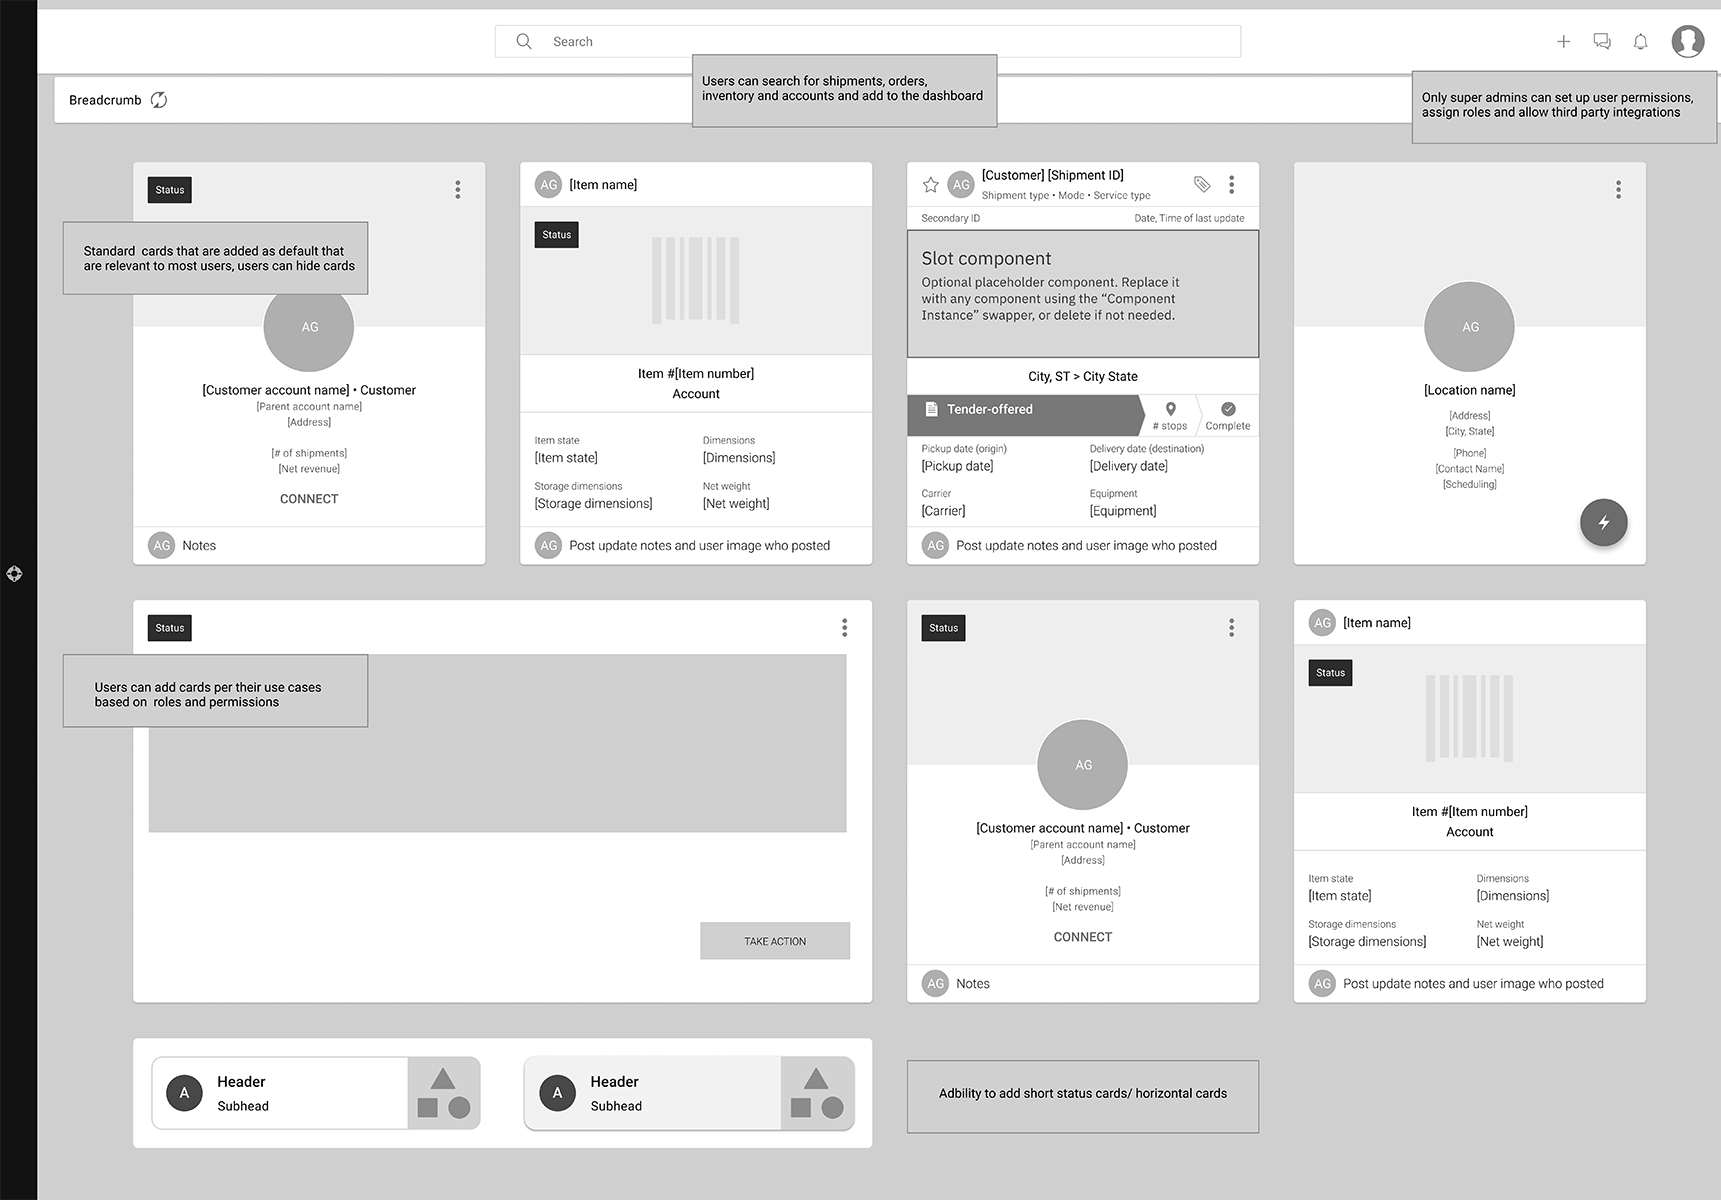
5. Design basic wireframes for quick input from immediate team members.
6. Review and update workflows after meeting with product and engineering.
7. Document decisions, tradeoffs, and future improvements
My role and responsibility
Hands-on leadership that included:
Research planning and execution, leading workshops with stakeholders, early design iteration, and final UI. Present designs, consolidate approvals, and continue meeting with product management and engineering throughout the development cycle. Create success metrics to monitor performance and plan future improvements.
Level of interactivity
Scalability and growth
Performance
User adoption
Dynamic Interface
Security and role-based permissions
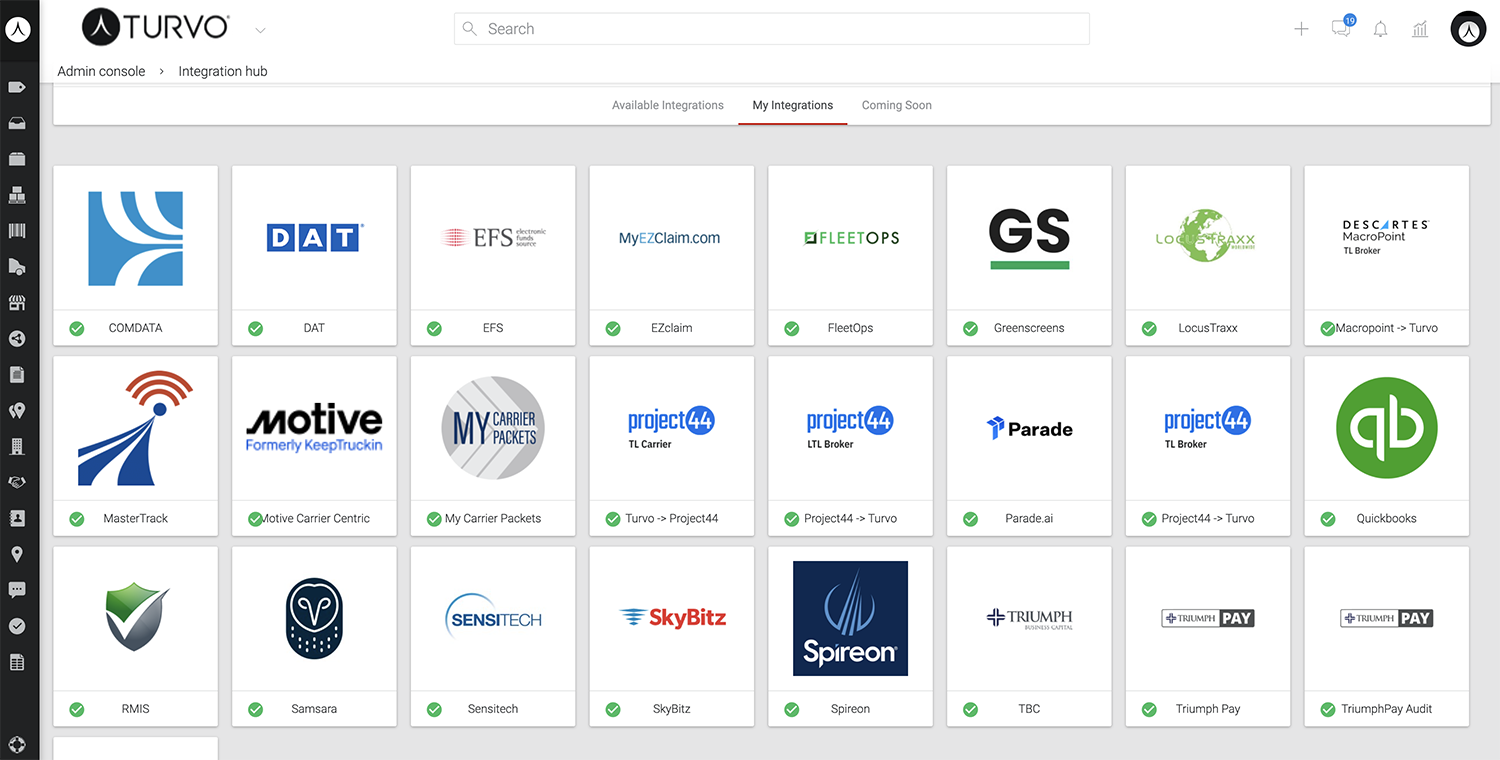
Access to different data sources
Third-party data integration