Analytics empowering brokers and carriers of any scale
DAT Freight and Analytics
Supply chain and logistics
Head of UX (research and design)
2.6 years (2019 - 2021)
Context
The end users
Frontline workers in logistics, warehouses and asset-based businesses (carriers)
The customer goal
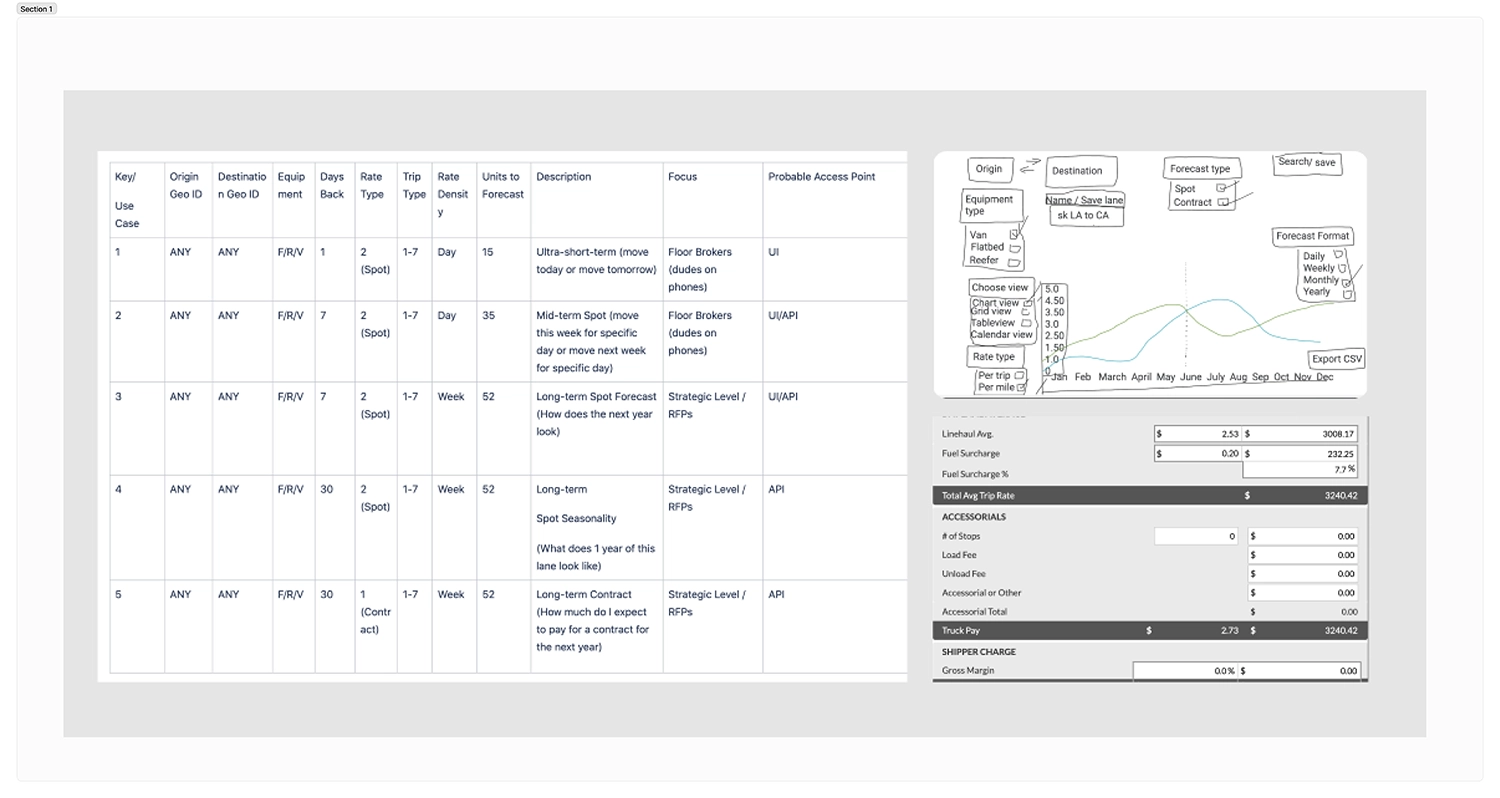
Ensure shipper, brokers and carriers have business intelligence with customizable reports on freight rates, supply-demand and market trends.
The business goal
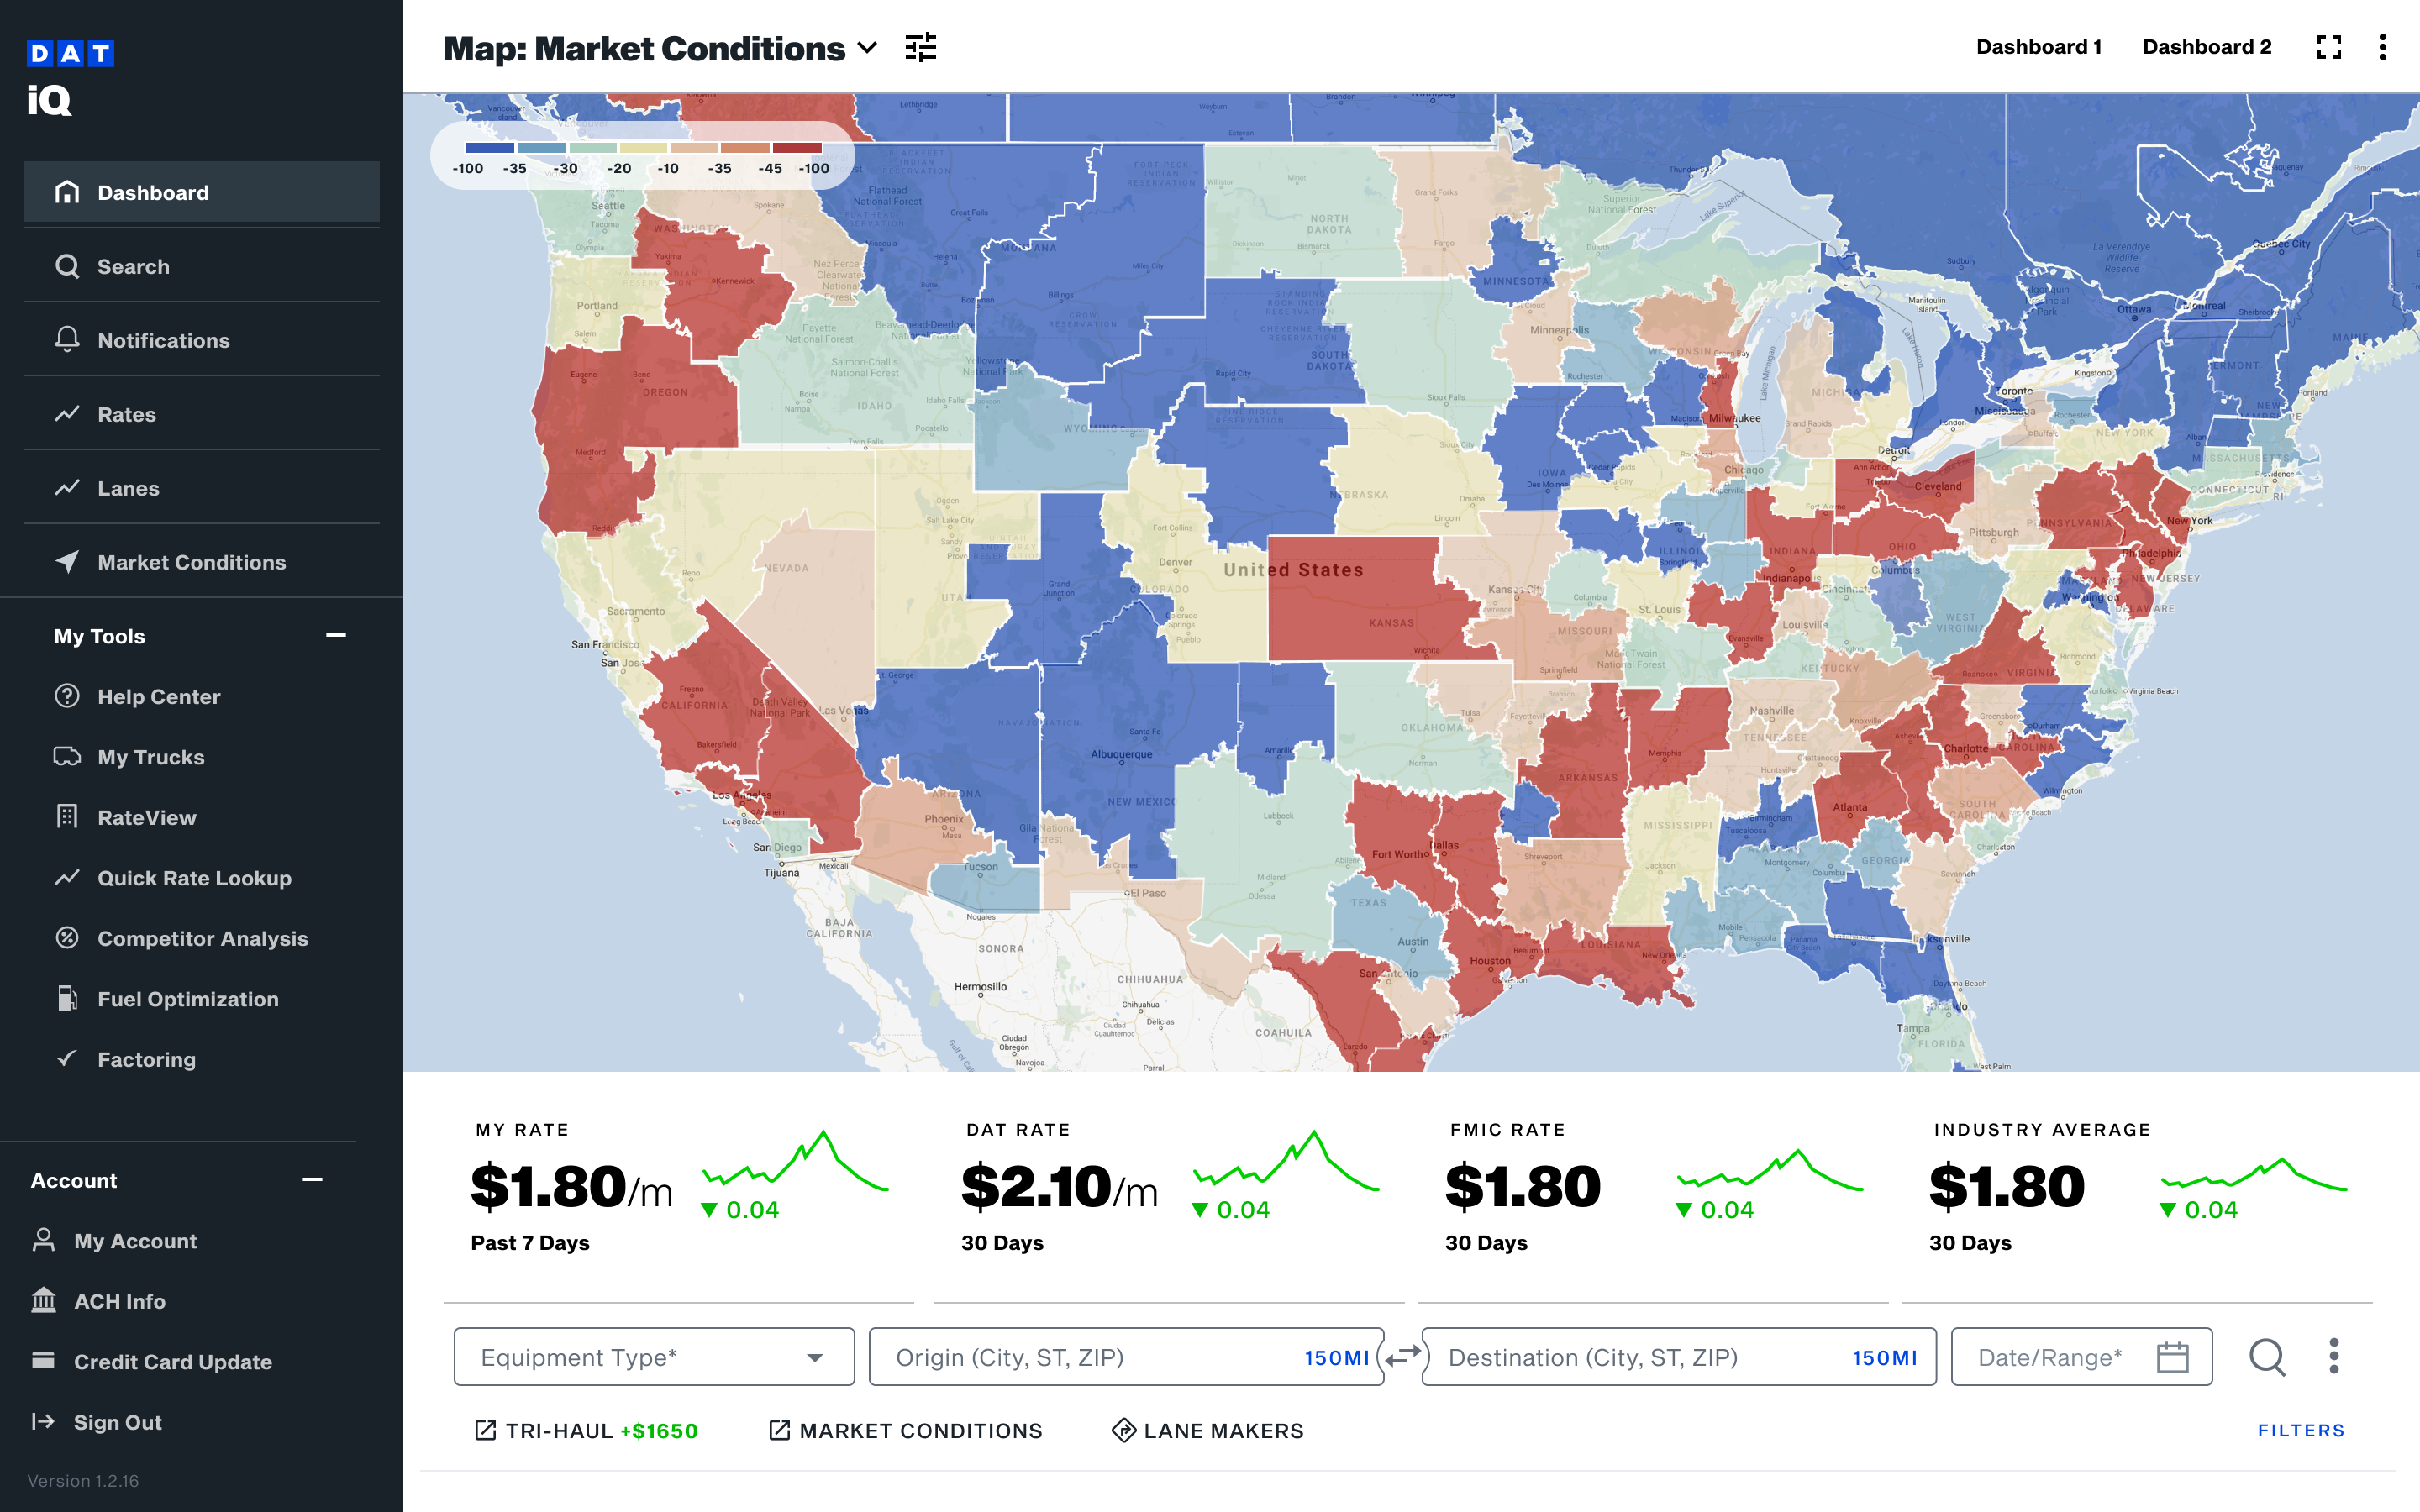
Provide business intelligence data through visualizations and an intuitive user interface. DAT wanted to empower their customers to expand their business via budget strategies, identify underperforming areas and reduce request for proposal (RFP) timelines.
The product hypothesis
DAT had limited reporting and analytics via Tableau for its enterprise customers. There was an opportunity to provide a subscription based service via a cloud based ecosystem for customers of any scale.
UX research goal
Validate the hypothesis, user goals, pain points and use cases, and recommend outcomes in order of priority.
The opportunity and outcome
DAT was consolidating their tech stack from legacy systems to AWS which offered a an opportunity to completely rethink the user interface.
Key to success:
Data integration, data analytics
Transform big to better data through traceability and quality control as a basis for AI enablement
Security and governance
Results:
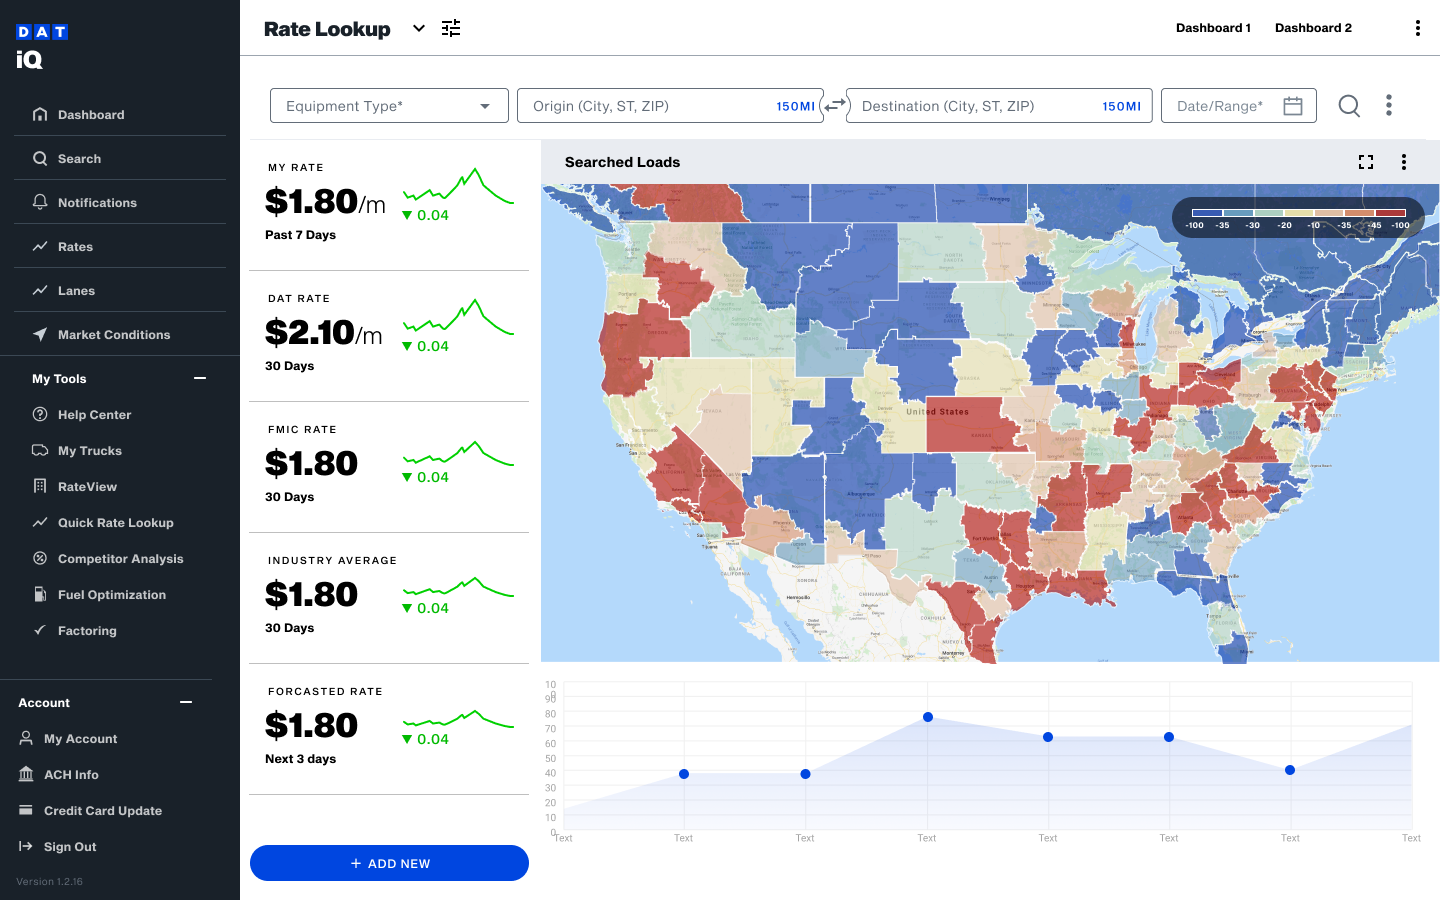
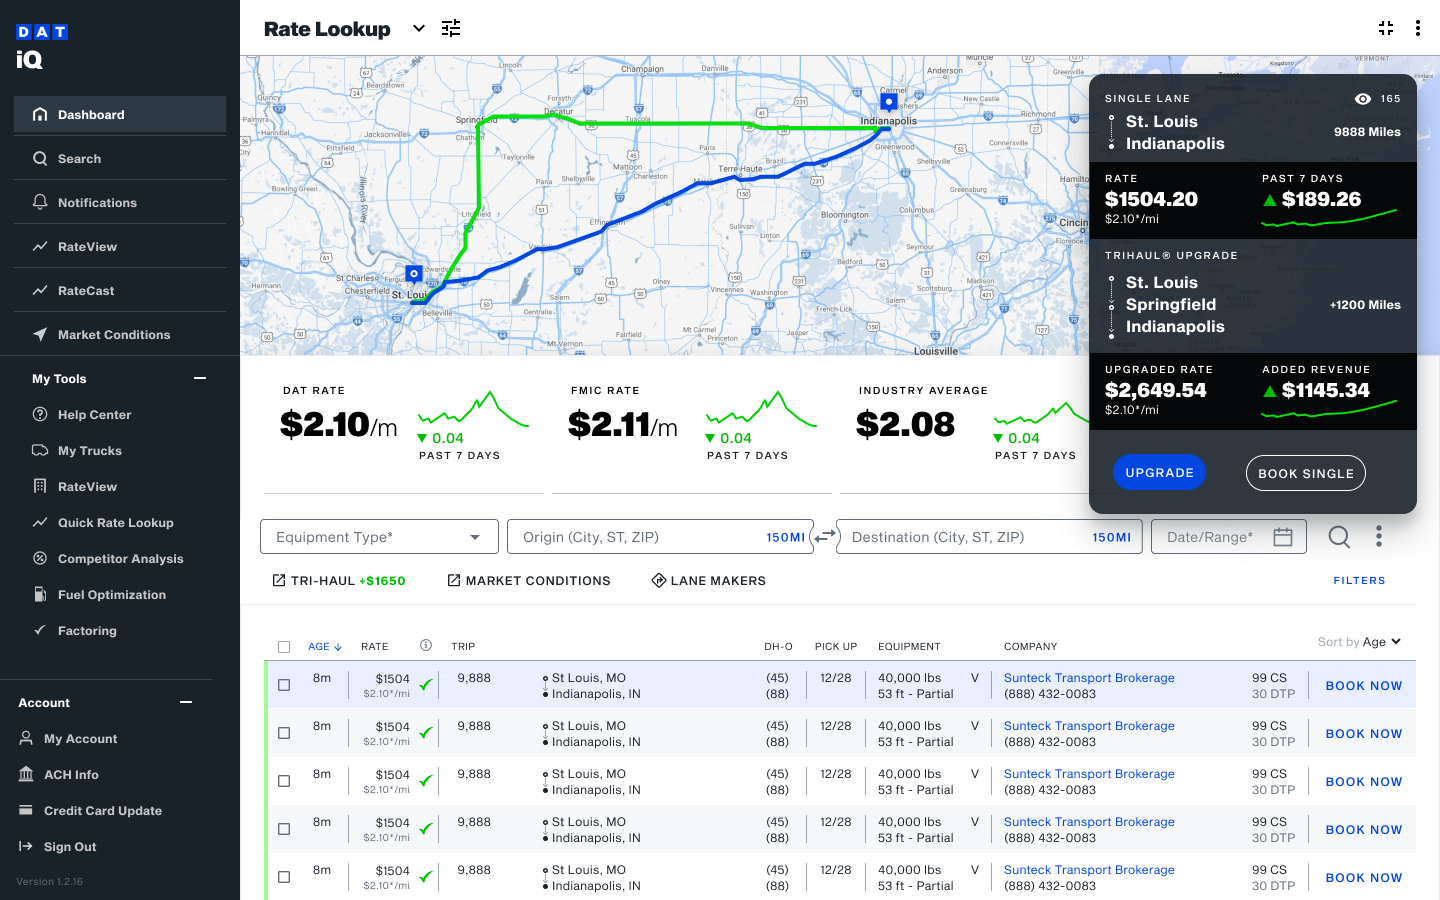
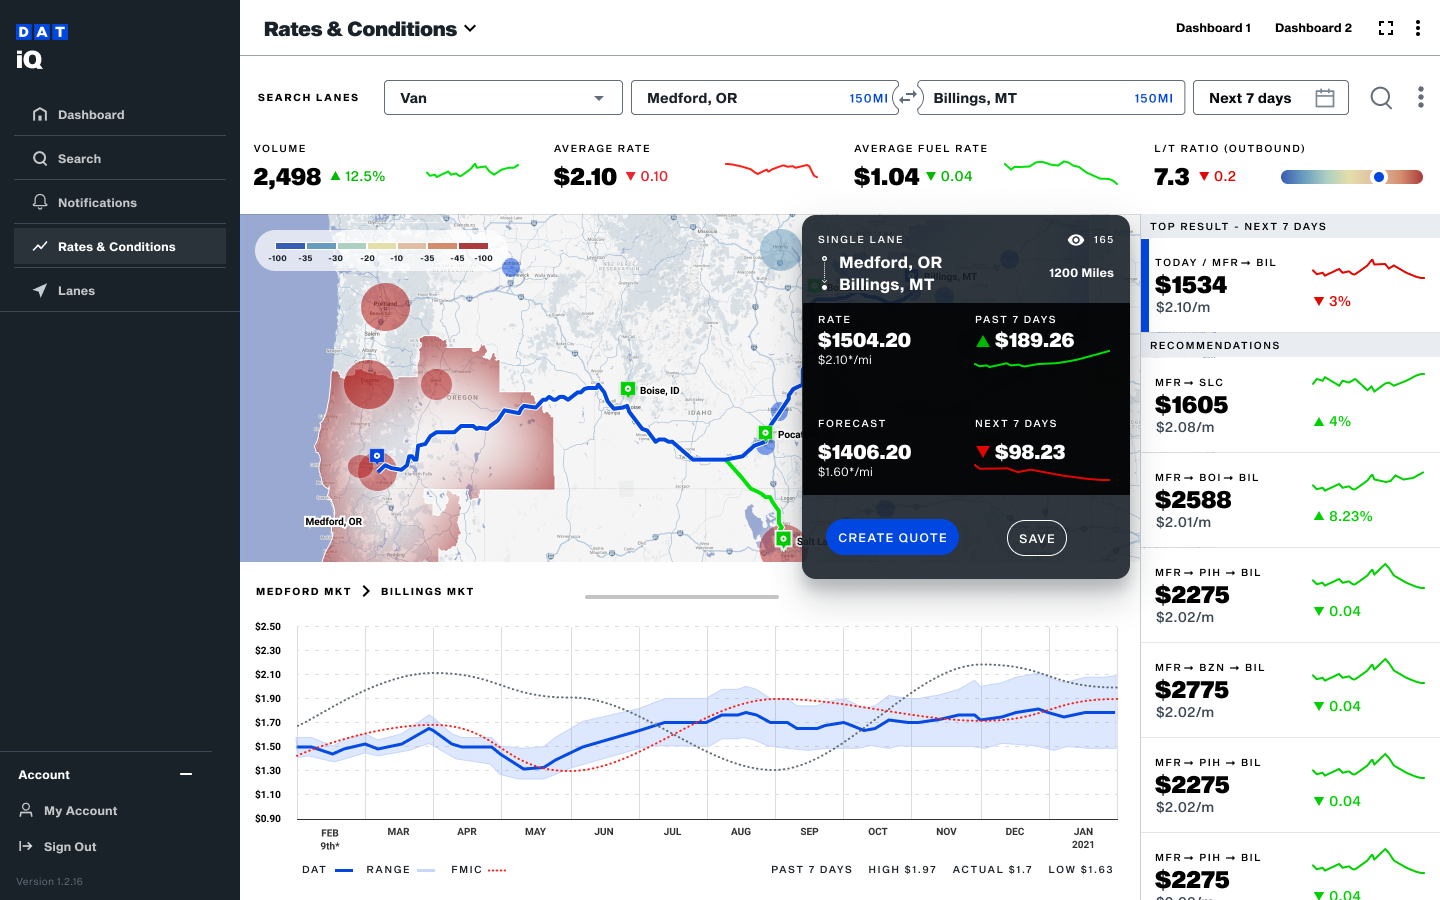
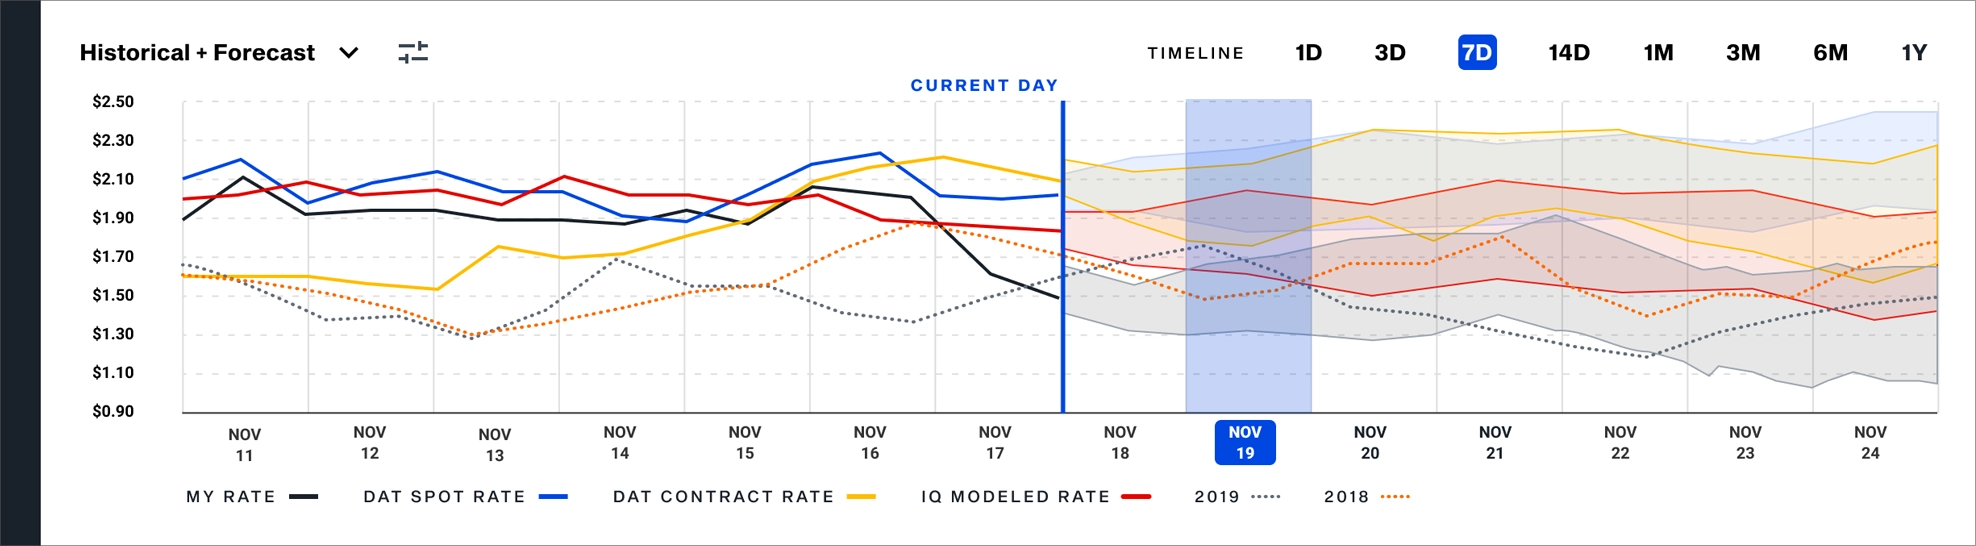
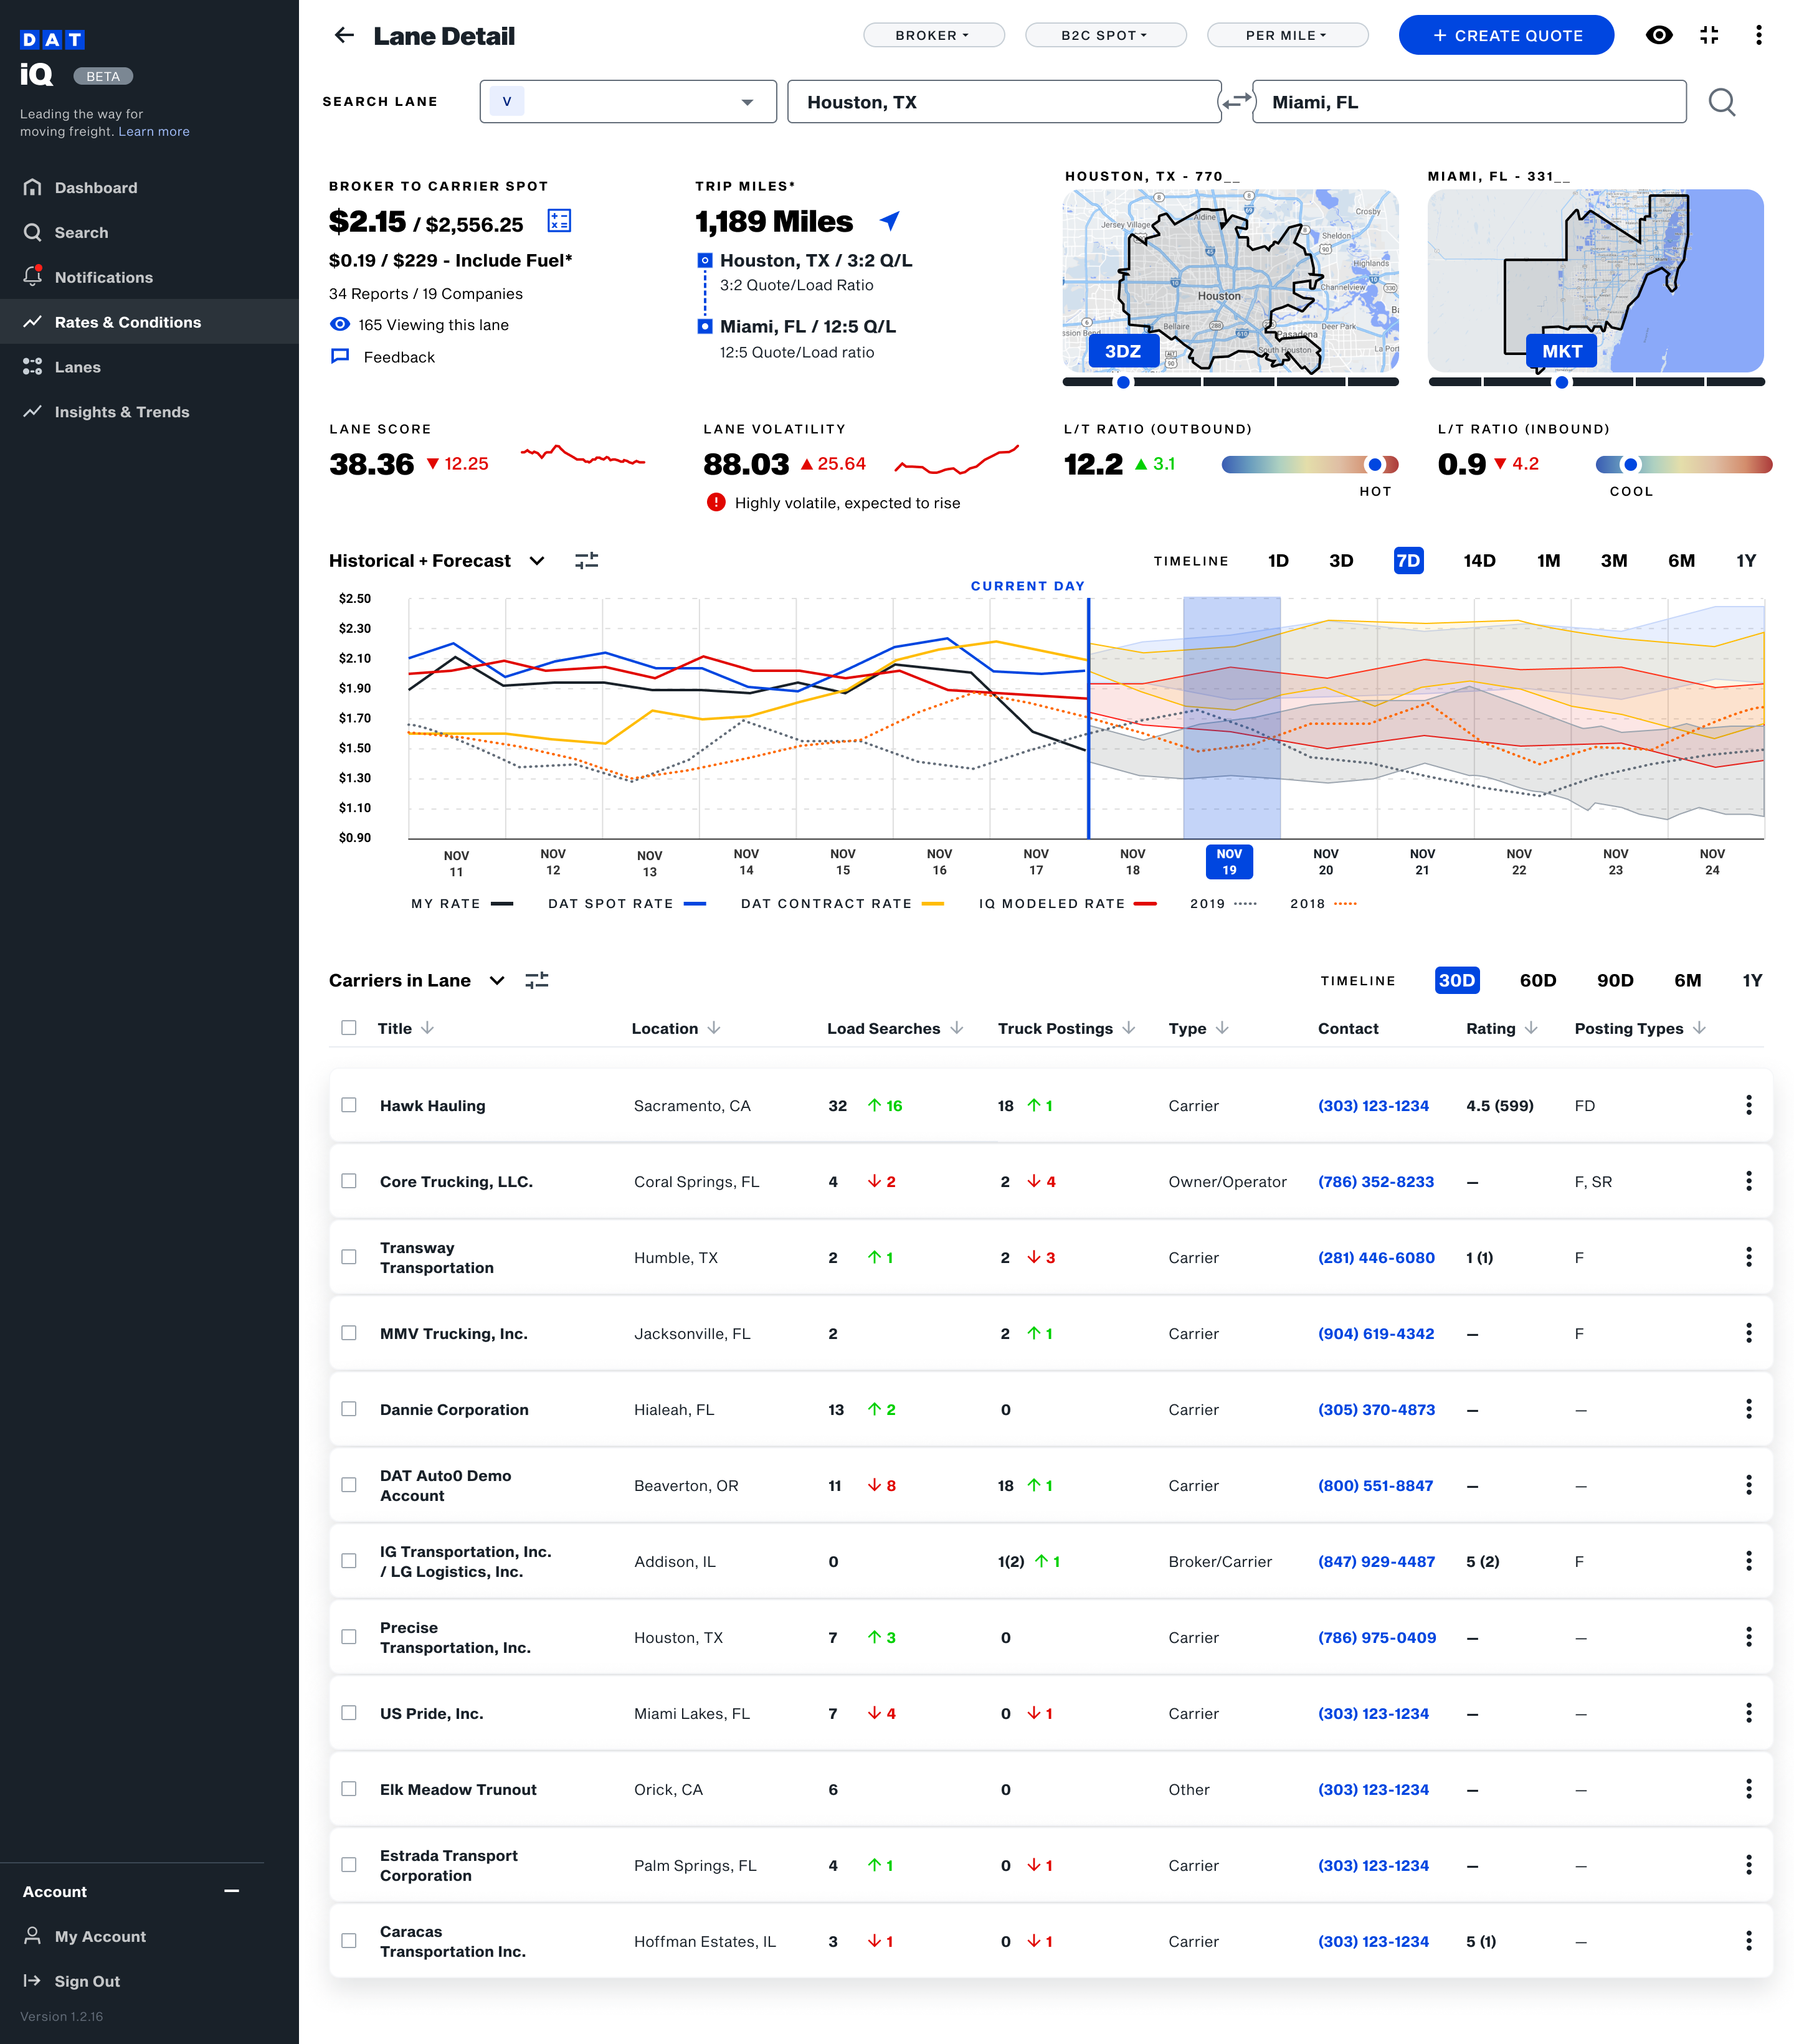
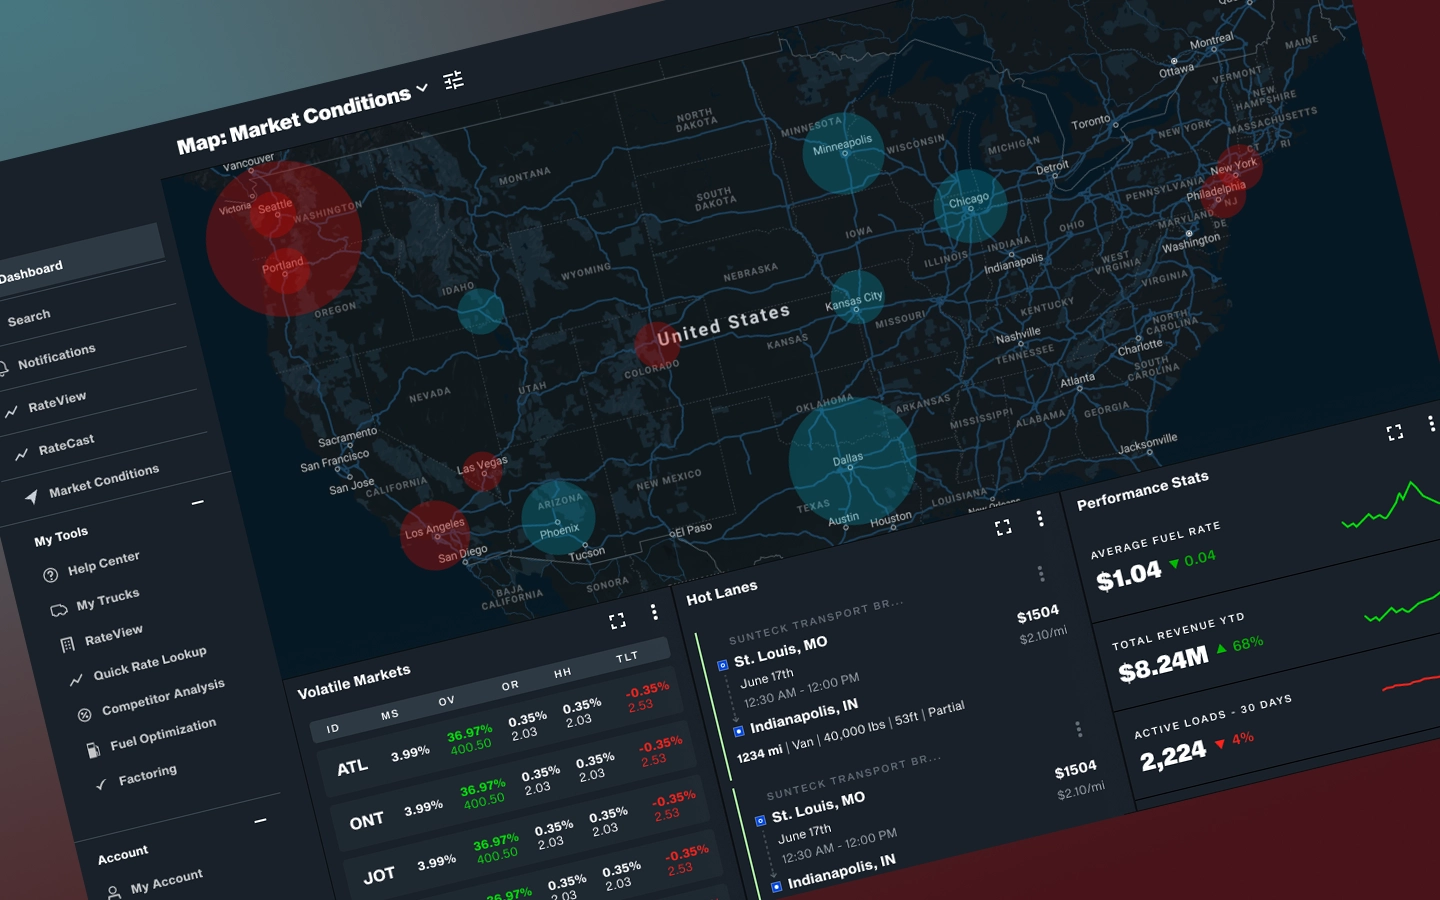
On demand dashboards allowed customers negotiating leverage, anticipate changes in rates, get advanced 7-day forecasts of future conditions and compare markets throughout the U.S. and Canada.
Customer outcome:
"Our forecasting confidence went up dramatically after using DAT's Market Conditions feature. We ended our contract with TruckerTools and established DAT as our preferred BI provider"
SVP, Business Strategy Lineage Logistics
My role and responsibility
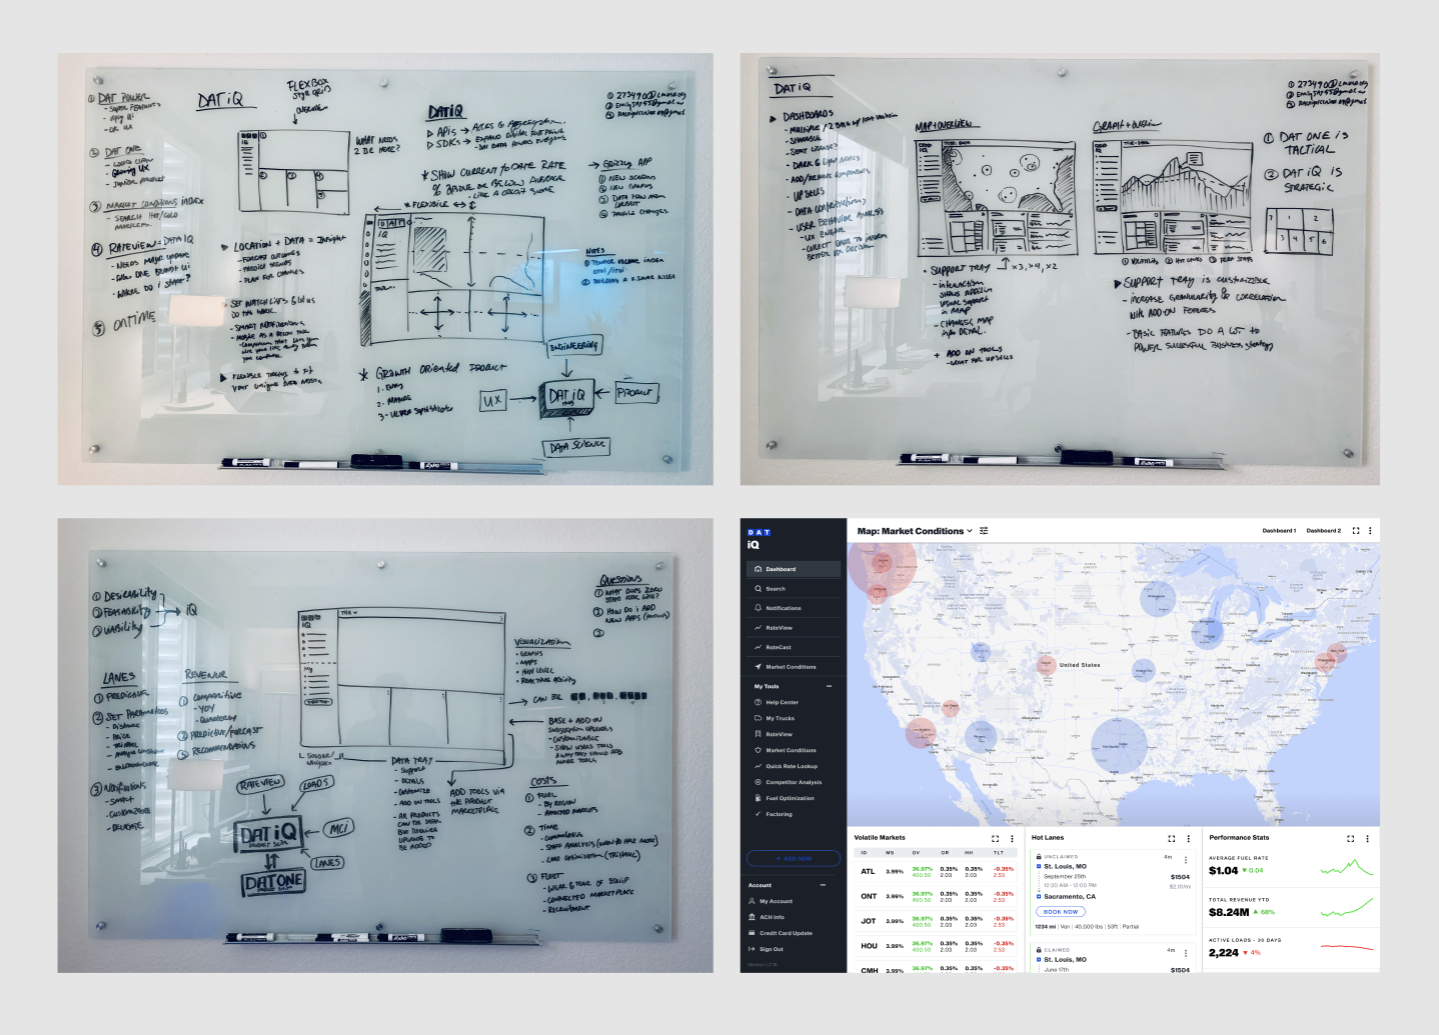
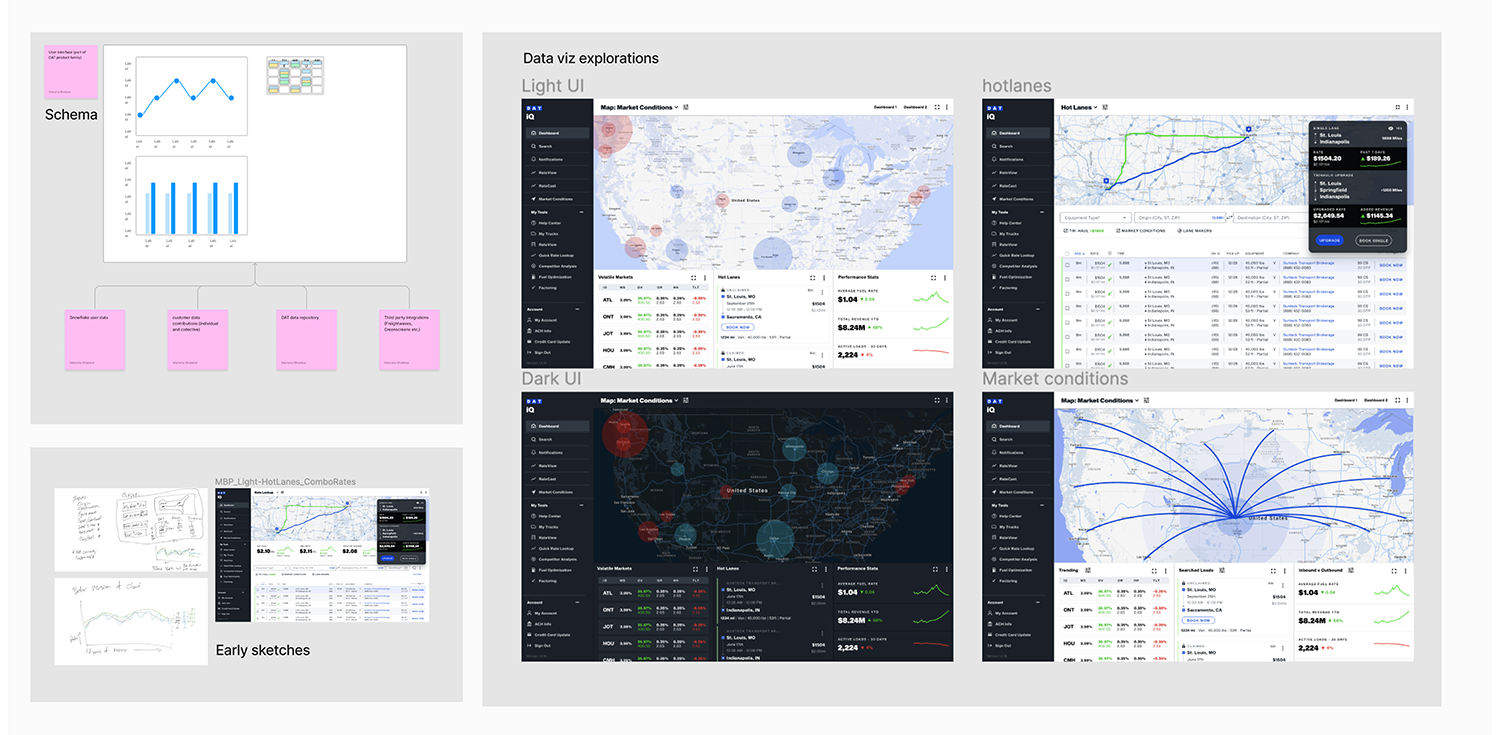
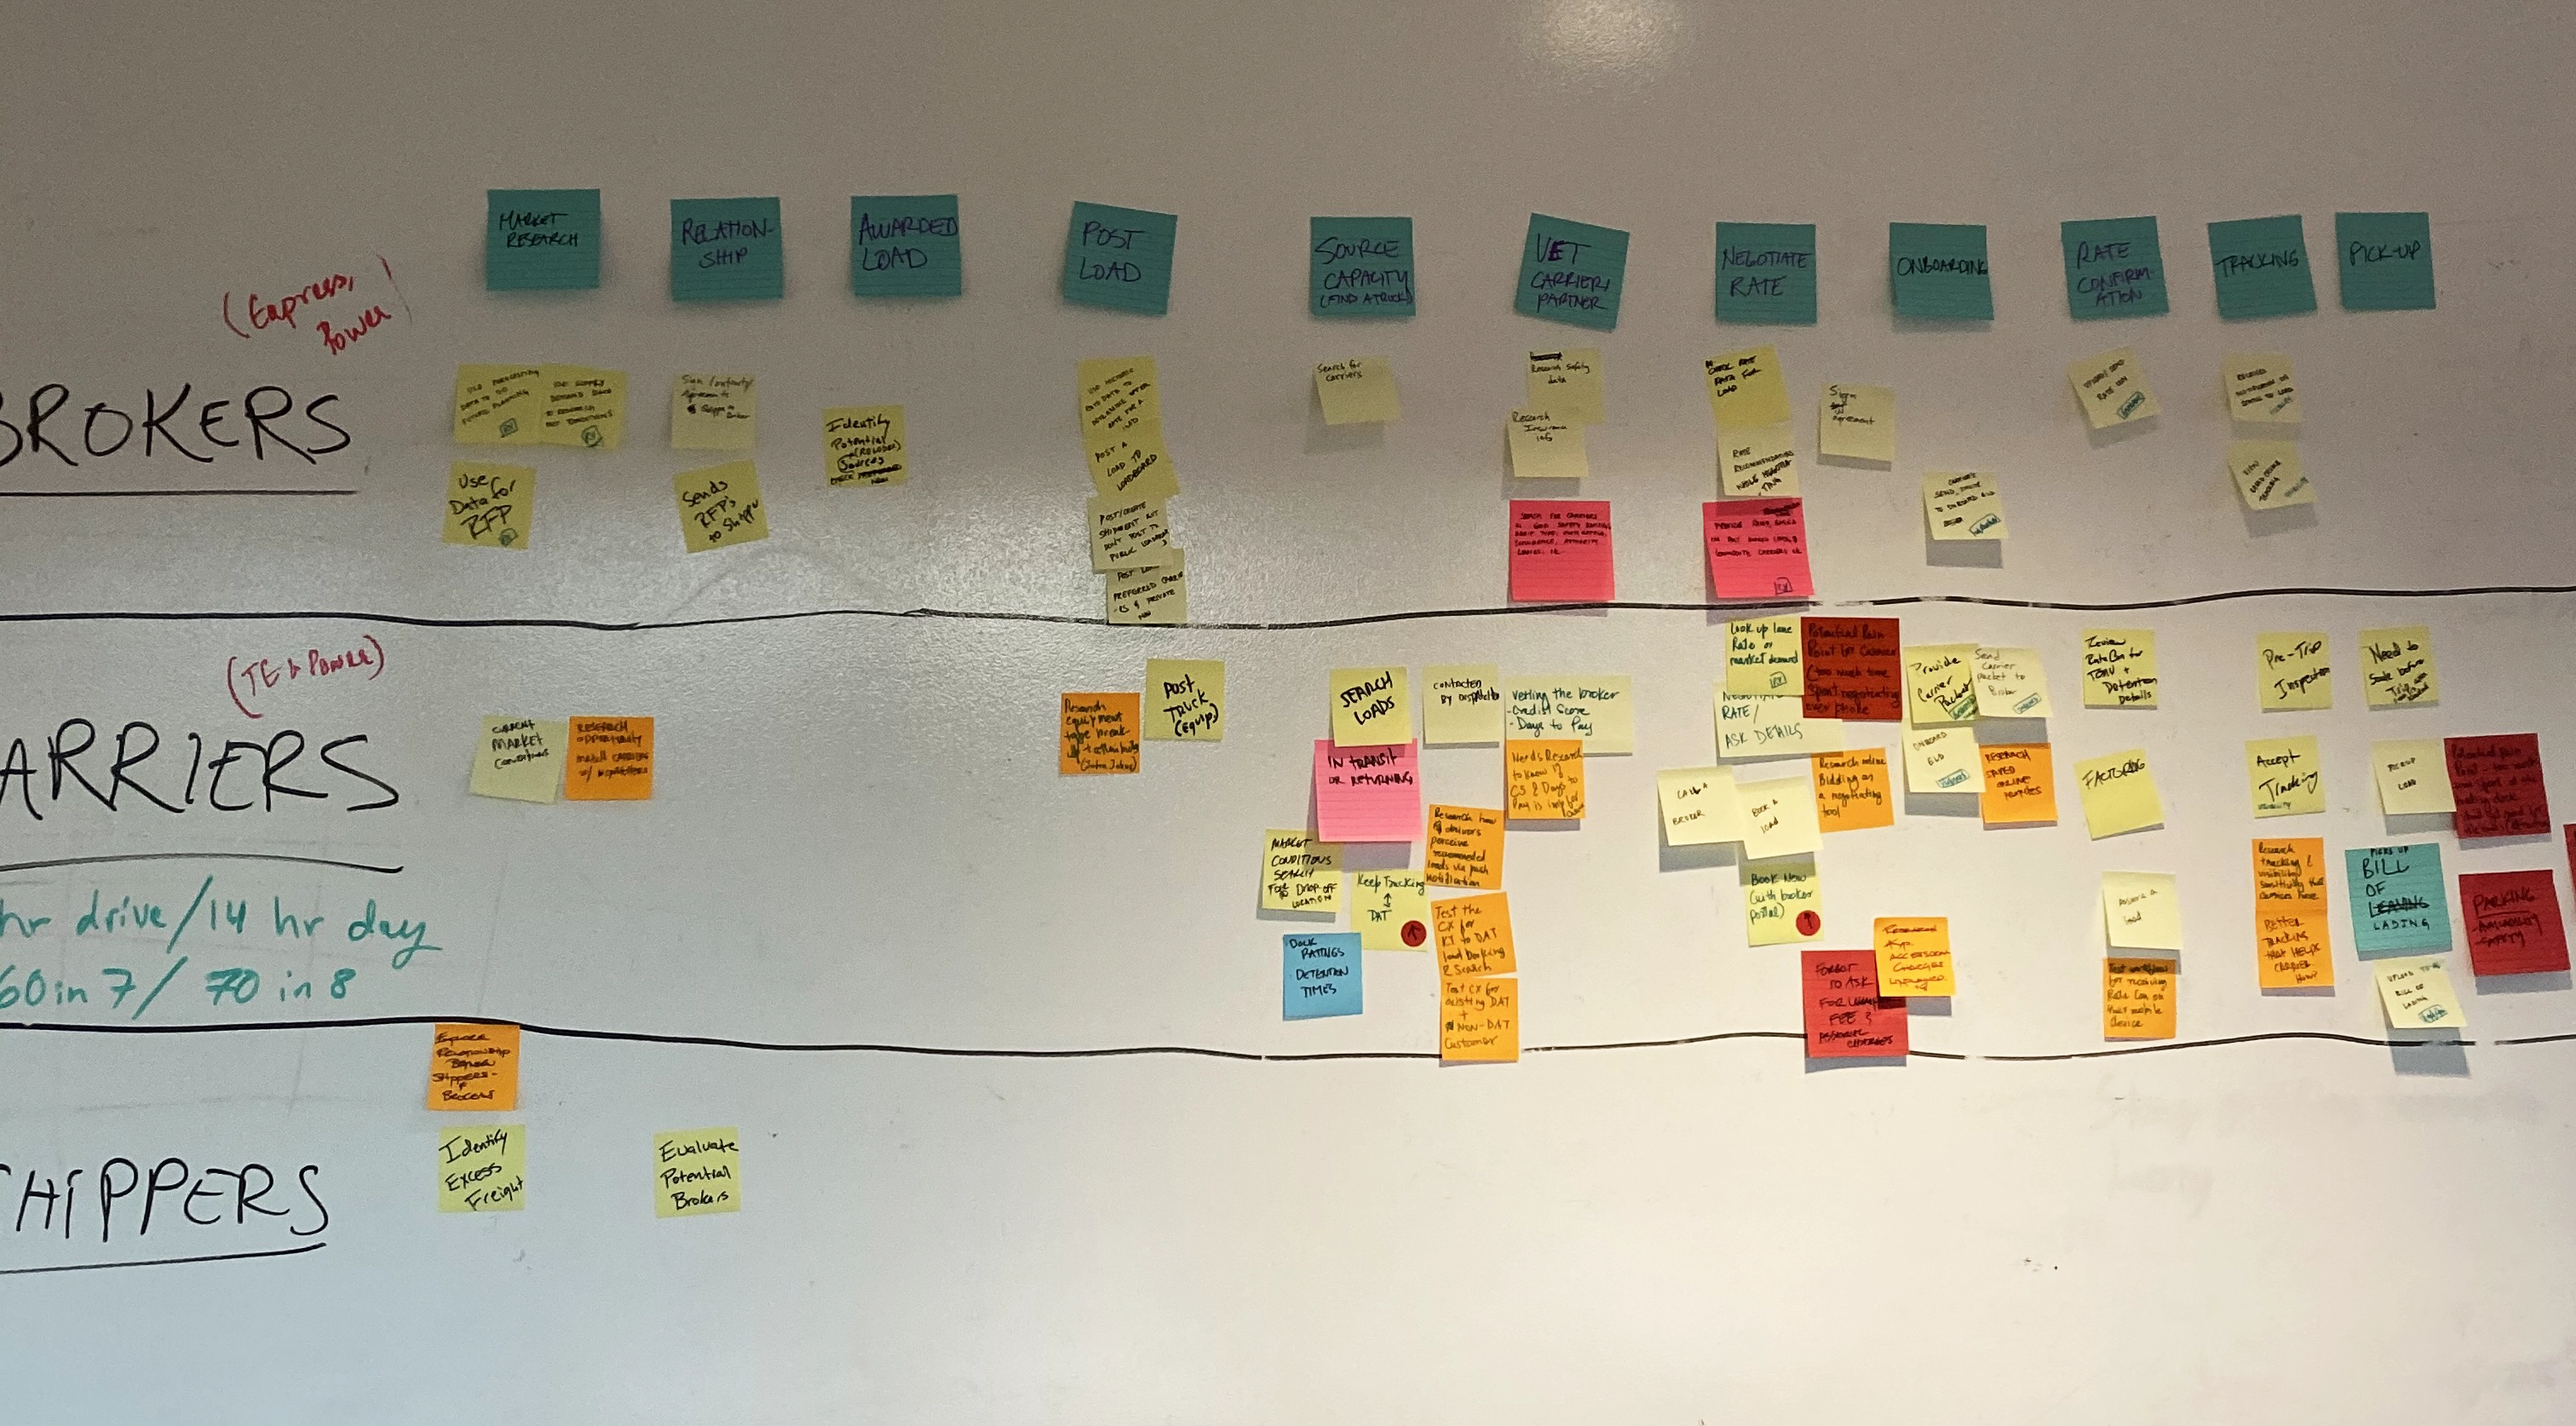
Hands-on leadership that included:
Validating hypothesis through qualitative research, observation and ethnography. Designing product MVP that was user tested at DATCON, DAT's customer conference